Huawei 2007 Annual Report Download - page 6
Download and view the complete annual report
Please find page 6 of the 2007 Huawei annual report below. You can navigate through the pages in the report by either clicking on the pages listed below, or by using the keyword search tool below to find specific information within the annual report.-
 1
1 -
 2
2 -
 3
3 -
 4
4 -
 5
5 -
 6
6 -
 7
7 -
 8
8 -
 9
9 -
 10
10 -
 11
11 -
 12
12 -
 13
13 -
 14
14 -
 15
15 -
 16
16 -
 17
17 -
18
-
19
-
20
-
21
-
22
-
23
-
24
-
25
-
26
-
27
-
28
-
29
-
30
-
31
-
32
-
33
-
34
-
35
-
36
-
37
-
38
-
39
-
40
-
41
-
42
-
43
-
44
 |
 |

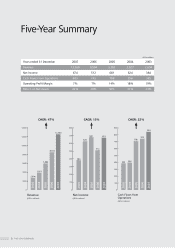
FIVE-YEAR SUMMARY
Five-Year Summary
Years ended 31 December 2007 2006 2005 2004 2003
Revenue 12,560 8,504 5,982 3,827 2,694
Net Income 674 512 681 624 384
Cash Flows From Operations 843 743 708 396 385
Operating Prot Margin 7% 7% 14% 18% 19%
Return on Net Assets 22% 20% 30% 31% 23%
CAGR: 47% CAGR: 15% CAGR: 22%
0
2000
4000
6000
8000
10000
12000
14000
0
100
200
300
400
500
600
700
800
0
100
200
300
400
500
600
700
800
900
Revenue
(USD in millions)
Net Income
(USD in millions)
Cash Flows from
Operations
(USD in millions)
USD in millions
2,694
3,827
5,982
8,504
12,560
384
624
681
512
674
385 396
708
743
843
3