Hormel Foods 2013 Annual Report Download - page 21
Download and view the complete annual report
Please find page 21 of the 2013 Hormel Foods annual report below. You can navigate through the pages in the report by either clicking on the pages listed below, or by using the keyword search tool below to find specific information within the annual report.-
 1
1 -
2
-
3
-
4
-
5
-
6
-
7
-
8
-
9
-
10
-
 11
11 -
 12
12 -
 13
13 -
 14
14 -
 15
15 -
 16
16 -
 17
17 -
 18
18 -
 19
19 -
 20
20 -
 21
21 -
 22
22 -
 23
23 -
 24
24 -
 25
25 -
 26
26 -
 27
27 -
 28
28 -
 29
29 -
 30
30 -
 31
31 -
32
-
33
-
34
-
35
-
36
-
37
-
38
-
39
-
40
-
41
-
42
-
43
-
44
-
45
-
46
-
47
-
48
-
49
-
50
-
51
-
52
-
53
-
54
-
55
-
56
-
57
-
58
-
59
-
60
-
61
-
62
-
63
-
64
-
65
-
66
 |
 |

19
SKIPPY® peanut butter products, profit results for the fourth
quarter and year benefitted from improved margin perfor-
mance in Hormel® Compleats® microwave meals and Hormel®
bacon toppings. Higher pork and beef input costs squeezed
margins of Hormel® chili and the SPAM® family of products.
Lower equity in earnings results from the MegaMex joint ven-
ture in also impacted profits due to higher incentive expense
on the Fresherized Food acquisition, unfavorable exchange
rates, and higher input costs.
Looking ahead, the Company expects continued sales growth
in fiscal 2014 for Grocery Products. The segment will benefit
from a full year of SKIPPY® peanut butter sales, and the
Company intends to launch the first national advertising
campaign in over ten years in support of the SKIPPY® line of
products in the latter half of fiscal 2014 to further enhance
sales. Continued volatile protein markets remain a concern
for this segment entering 2014, and the need for pricing
actions will be assessed to protect margin contributions as
the year progresses.
Refrigerated Foods: Net sales for the Refrigerated Foods
segment increased 4.2 percent for the fiscal 2013 fourth quar-
ter and increased 0.7 percent for the year compared to fiscal
2012. Tonnage decreased 4.8 percent for the fourth quarter
and decreased 3.7 percent for the fiscal year compared to
prior year results, as planned reductions in this segment’s
feed sales business beginning late in the first quarter of fiscal
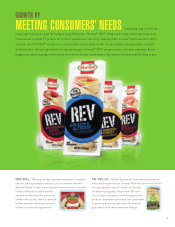
Grocery Products: Grocery Products net sales increased 23.3
percent for the fiscal 2013 fourth quarter and 29.6 percent
for the year compared to fiscal 2012. Tonnage increased 24.4
percent for the quarter and 29.1 percent for the year com-
pared to prior year results. The comparative results reflect
the addition of the newly acquired SKIPPY® peanut butter
business beginning in the second quarter of fiscal 2013 and
Don Miguel Foods Corp. sales (additional product lines within
the MegaMex joint venture) beginning in the third quarter of
fiscal 2012 when the Company’s retail sales force assumed
responsibility for these sales. The addition of the SKIPPY®
peanut butter business contributed an incremental $75.6
million of net sales and 48.1 million lbs. to the top-line results
for the fourth quarter. On a combined basis, these businesses
contributed an incremental $322.0 million of net sales and
182.8 million lbs. to the top-line results for fiscal 2013.
Improved sales in both the fourth quarter and fiscal year were
recorded for Hormel® bacon toppings and the Herdez® and
Don Miguel® products within the Company’s MegaMex Foods
joint venture which offset declines in categories such as
Hormel® chili and Hormel® chunk meats. Sales of the Hormel®
Compleats® line of microwave meals were also strong,
enhanced by the introduction of new breakfast meal items
towards the end of the third quarter.
Segment profit for Grocery Products increased 17.0 percent
for the fourth quarter and 17.9 percent for the year compared
to fiscal 2012. Along with the positive performance from the
Segment Results
Net sales and operating profits for each of the Company’s reportable segments are set forth below. The Company is an inte-
grated enterprise, characterized by substantial intersegment cooperation, cost allocations, and sharing of assets. Therefore, the
Company does not represent that these segments, if operated independently, would report the operating profit and other finan-
cial information shown below. (Additional segment financial information can be found in Note O “Segment Reporting.”)
Fourth Quarter Ended Year Ended
October 27, October 28, October 27, October 28,
(in thousands) 2013 2012 % Change 2013 2012 % Change
Net Sales
Grocery Products $ 419,615 $ 340,222 23.3 $ 1,517,557 $ 1,170,871 29.6
Refrigerated Foods 1,108,157 1,063,941 4.2 4,251,515 4,222,752 0.7
Jennie-O Turkey Store 459,670 429,199 7.1 1,601,868 1,549,227 3.4
Specialty Foods 212,485 247,429 (14.1) 932,533 924,472 0.9
International & Other 123,275 89,393 37.9 448,181 363,348 23.3
Total $ 2,323,202 $ 2,170,184 7.1 $ 8,751,654 $ 8,230,670 6.3
Segment Operating Profit
Grocery Products $ 63,476 $ 54,248 17.0 $ 213,646 $ 181,251 17.9
Refrigerated Foods 79,453 61,150 29.9 232,692 228,665 1.8
Jennie-O Turkey Store 65,550 52,232 25.5 222,117 238,298 (6.8)
Specialty Foods 15,975 24,093 (33.7) 88,873 83,089 7.0
International & Other 22,069 12,126 82.0 71,490 49,889 43.3
Total segment operating profit 246,523 203,849 20.9 828,818 781,192 6.1
Net interest and investment
expense (income) 595 1,407 (57.7) 7,482 6,339 18.0
General corporate expense 7,466 3,389 120.3 26,694 21,429 24.6
Noncontrolling interest 1,145 1,685 (32.0) 3,865 4,911 (21.3)
Earnings before income taxes $ 239,607 $ 200,738 19.4 $ 798,507 $ 758,335 5.3