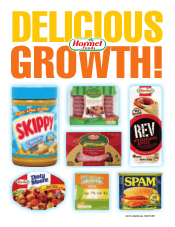
Hormel Foods 2013 Annual Report Download - page 2
Download and view the complete annual report
Please find page 2 of the 2013 Hormel Foods annual report below. You can navigate through the pages in the report by either clicking on the pages listed below, or by using the keyword search tool below to find specific information within the annual report.-
 1
1 -
 2
2 -
 3
3 -
 4
4 -
 5
5 -
 6
6 -
 7
7 -
 8
8 -
 9
9 -
 10
10 -
 11
11 -
 12
12 -
 13
13 -
14
-
15
-
16
-
17
-
18
-
19
-
20
-
21
-
22
-
23
-
24
-
25
-
26
-
27
-
28
-
29
-
30
-
31
-
32
-
33
-
34
-
35
-
36
-
37
-
38
-
39
-
40
-
41
-
42
-
43
-
44
-
45
-
46
-
47
-
48
-
49
-
50
-
51
-
52
-
53
-
54
-
55
-
56
-
57
-
58
-
59
-
60
-
61
-
62
-
63
-
64
-
65
-
66
 |
 |

Financial Highlights
(in thousands, except per share amounts) 2013 2012 Change % Change
Net Sales $8,751,654 $8,230,670 $520,984 6.3%
Net Earnings Attributable to
Hormel Foods Corporation 526,211 500,050 26,161 5.2
Percent of Sales 6.0% 6.1%
Earnings Per Share
Basic $ 1.99 $ 1.90 $ 0.09 4.7
Diluted 1.95 1.86 0.09 4.8
Dividends Declared to Shareholders 179,782 157,752 22,030 14.0
Per Share of Common Stock 0.68 0.60 0.08 13.3
Weighted-Average Shares Outstanding
Basic 264,317 263,466 851 0.3
Diluted 270,224 268,891 1,333 0.5
Capital Additions $ 106,762 $ 132,303 $ (25,541) (19.3)
Depreciation and Amortization 124,850 119,494 5,356 4.5
Working Capital 1,263,404 1,534,384 (270,980) (17.7)
Hormel Foods Corporation
Shareholders’ Investment 3,311,040 2,819,455 491,585 17.4
Net Sales
Dollars in billions
Compound annual growth
rate (CAGR ) 7.6%
Diluted Earnings
Dollars per share
CAGR 11.3%
Segment
Operating Profit
Dollars in millions
CAGR 9.7%
Annual Dividends
Dollars per share
CAGR 15.7%
1312111009
$8.8
$8.2
$7.9
$7.2
$6.5
1312111009
$1.95
$1.86
$1.74
$1.46
$1.27
1312111009
$829
$781
$773
$683
$572
1312111009
$0.68
$0.60
$0.51
$0.42
$0.38