Hormel Foods 2013 Annual Report Download
Download and view the complete annual report
Please find the complete 2013 Hormel Foods annual report below. You can navigate through the pages in the report by either clicking on the pages listed below, or by using the keyword search tool below to find specific information within the annual report.-
 1
1 -
 2
2 -
 3
3 -
 4
4 -
 5
5 -
 6
6 -
 7
7 -
 8
8 -
 9
9 -
 10
10 -
 11
11 -
 12
12 -
13
-
14
-
15
-
16
-
17
-
18
-
19
-
20
-
21
-
22
-
23
-
24
-
25
-
26
-
27
-
28
-
29
-
30
-
31
-
32
-
33
-
34
-
35
-
36
-
37
-
38
-
39
-
40
-
41
-
42
-
43
-
44
-
45
-
46
-
47
-
48
-
49
-
50
-
51
-
52
-
53
-
54
-
55
-
56
-
57
-
58
-
59
-
60
-
61
-
62
-
63
-
64
-
65
-
66
 |
 |

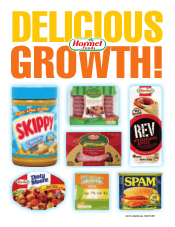
DELICIOUS
GROWTH!
2013 ANNUAL REPORT
Table of contents
-
Page 1
DELICIOUS GROWTH! 2013 ANNUAL REPORT -
Page 2
...2013 2012 Change % Change Net Sales Net Earnings Attributable to Hormel Foods Corporation Percent of Sales Earnings Per Share Basic Diluted Dividends Declared to Shareholders Per Share of Common Stock... 4.5 (17.7) 17.4 Net Sales Dollars in billions Compound annual growth rate (CAGR ) 7.6% Diluted... -
Page 3
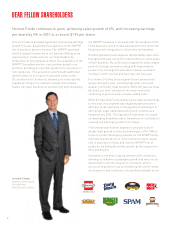
DELICIOUS GROWTH! In 1891, Geo. A. Hormel & Company began as a small pork and meat packing business in Austin, Minnesota. Today, Hormel Foods Corporation has grown to produce many of the most trusted and delicious branded food products for consumers around the world. Page 4: Page 5: Page 6: ... -
Page 4
... year. Our Jennie-O Turkey Store segment faced several challenges during the year, including high grain costs and weaker commodity meat markets. While full year earnings declined, our team was able to increase revenue by continuing to grow its sales of value-added items. While the Specialty Foods... -
Page 5
... was promoted to Vice President of Sales, Foodservice. In September, Dr. Phillip L. Minerich, Vice President of Research and Development, announced his retirement effective December 31, 2013. During his career at Hormel Foods, Minerich signiï¬cantly advanced the Company's food science capabilities... -
Page 6
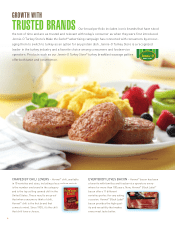
... choice among consumers and foodservice operators. Products such as our Jennie-O Turkey Store® turkey breakfast sausage patties ® BRAND Serving suggestion CRAVED BY CHILI LOVERS - Hormel® chili, available in 10 varieties and sizes, including a less sodium variety, is the number one brand... -
Page 7
... of the SKIPPY line of products added yet another iconic brand to the Hormel Foods portfolio and supplemented our natural product offerings with the SKIPPY® Natural line. As a shelf-stable protein, SKIPPY® products are a perfect ï¬t within our Grocery Products portfolio domestically, and... -
Page 8
... in Canada is a diverse business across multiple channels. From grocery products to foodservice to refrigerated items, Hormel Foods products are well represented. Our Hormel® deli tray and Hormel® snack tray offer Canadians a great tasting and convenient solution for any gathering, ready to open... -
Page 9
... REAL CHEESE - Our team utilized innovative technologies to add real cheeses to our new Hormel® Compleats® cheesy pasta items while maintaining the taste, texture, appearance, and nutritional quality of this shelf-stable food. From traditional mac and cheese to zesty smoky bacon Parmesan rigatoni... -
Page 10
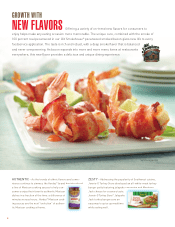
... cooking at home. ZESTY - Addressing the popularity of Southwest cuisine, Jennie-O Turkey Store developed an all-white-meat turkey burger patty featuring jalapeño seasoning and Monterey Jack cheese for a savory taste. Jennie-O Turkey Store® Jalapeño Jack turkey burgers are an easy way to spice... -
Page 11
... products, it's no wonder Hormel® Natural Choice is one of our fastest growing brands. Hormel ® ON-THE-GO - Wholly Guacamole® minis were introduced with snacking on-the-go in mind. Peel the lid back a little for an easy squeeze or peel it back all the way for delicious dipping. These new... -
Page 12
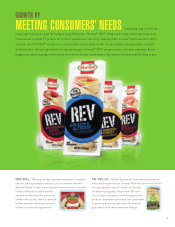
...Foods line-up of products has the brands to deliver, including all-natural Hormel® Natural Choice® sliced deli meats, Hormel® pepperoni, Hormel® REV® snack wraps, Hormel® refrigerated entrees, Hormel® Country Crock® refrigerated side dishes, Hormel® Black Label® bacon, Hormel® party trays... -
Page 13
...Diamond Crystal Brands, and Hormel Specialty Products, the Specialty Foods segment offers high quality products to health care facilities, retail customers, foodservice operators, and food manufacturers. Individual serving restaurant packets, nutritional food products, stocks and broths, supplements... -
Page 14
...Hormel Foods) Walmart (March 2013) Fresh Food Vendor of the Year (Don Miguel) 7-Eleven (April 2013) Supplier of the Year (Don Miguel) Stripes Foodservice (April 2013) Employer Awards Top 25 Best Places to Work For Recent Grads (Hormel Foods) Connect EDU (May 2013) 50 Best Companies to Sell For list... -
Page 15
... other companies in our industry. Management uses EBIT as a component of certain executive plans, but does not utilize EBITDA for any material purpose. These measures are calculated as follows: 2013 2012 2011 2010 2009 (1) EBIT: Net Earnings Attributable to Hormel Foods Corporation Plus: Income... -
Page 16
...family of products and fresh pork, along with improved proï¬tability by the Company's China operations. The results for the Refrigerated Foods segment improved slightly over last year, as the impact of higher pork input costs weighed on the value-added Meat Products and Foodservice businesses. Pork... -
Page 17
...." The meat cost pool is determined by combining the cost to grow turkeys with processing costs, less any net sales revenue from by-products created from the processing and not used in producing Company products. The Company has developed a series of ratios using historical data and current market... -
Page 18
... In accounting for these employment costs, management must make a variety of assumptions and estimates including mortality rates, discount rates, overall Company compensation increases, expected return on plan assets, and health care cost trend rates. The Company considers historical data as well as... -
Page 19
..., foodservice, and fresh product customers. This segment includes the Diamond Crystal Brands (DCB), Century Foods International (CFI), and Hormel Specialty Products (HSP) operating segments. This segment consists of the packaging and sale of private label shelf stable products, nutritional products... -
Page 20
... year increased compared to ï¬scal 2012 in four of the Company's ï¬ve reporting segments. Moving into ï¬scal 2014, the Company expects continued improved results from the Grocery Products, Refrigerated Foods, Jennie-O Turkey Store, and International & Other segments. The Specialty Foods segment... -
Page 21
... (Additional segment ï¬nancial information can be found in Note O "Segment Reporting.") Fourth Quarter Ended (in thousands) October 27, 2013 October 28, 2012 % Change October 27, 2013 Year Ended October 28, 2012 % Change Net Sales Grocery Products Refrigerated Foods Jennie-O Turkey Store Specialty... -
Page 22
... high hog costs. Additionally, retail bacon pricing actions taken during the third quarter drove improved margins toward the end of ï¬scal 2013. Entering ï¬scal 2014, the Company expects more normalized pork operating margins and continued growth in the Refrigerated Foods value-added product lines... -
Page 23
...scal 2011. Increased value-added sales across all segments of the Company drove the top-line results for both the fourth quarter and ï¬scal year in 2012. The more modest tonnage increase reï¬,ected a decline in commodity meat sales for both the Refrigerated Foods and Jennie-O Turkey Store segments... -
Page 24
.... Jennie-O Turkey Store generated strong margins for ï¬scal year 2012, as value-added sales growth and ongoing operational efï¬ciencies were able to overcome the impact of signiï¬cantly higher feed costs. Lower raw material costs and an improved product mix also enhanced margins for the Company... -
Page 25
... 2012 for Hormel® Natural Choice® deli meats, Hormel® party trays, and Hormel® pepperoni. Sales of Hormel® Cure 81® premium hams, Hormel® refrigerated entrees, and convenience bacon were also strong during the fourth quarter of ï¬scal 2012. Within the Foodservice business unit, sales gains... -
Page 26
... The top-line growth was driven by continued strength in sales of value-added products and an improved product mix. Valueadded net sales experienced double-digit growth for both the 2012 fourth quarter and ï¬scal year, led by sales of Jennie-O Turkey Store® fresh tray pack items and turkey burgers... -
Page 27
... 10,000,000 shares of its common stock with no expiration date. The Company's prior share repurchase program authorized in ï¬scal 2010 was fully utilized prior to commencing purchases under this new authorization. At of the end of ï¬scal 2013, there were 9.4 million shares remaining for repurchase... -
Page 28
... supply of production inputs. Certain of these contracts are based on market prices at the time of delivery, for which the Company has estimated the purchase commitment using current market prices as of October 27, 2013. The Company also utilizes various hedging programs to manage the price risk... -
Page 29
... fund supplemental executive retirement plans and deferred income plans, and the Company's assets held in pension plans. The Company also utilizes hedging programs to manage its exposure to various commodity market risks, which qualify for hedge accounting for ï¬nancial reporting purposes. Volatile... -
Page 30
... price; • product quality and attributes; • brand identiï¬cation; • breadth of product line; and • customer service. Demand for the Company's products is also affected by competitors' promotional spending, the effectiveness of the Company's advertising and marketing programs, and consumer... -
Page 31
...litigation may include class actions involving employees, consumers, competitors, suppliers, shareholders, or injured persons, and claims relating to product liability, contract disputes, intellectual property, advertising, labeling, wage and hour laws, employment practices, or environmental matters... -
Page 32
... market prices would have negatively impacted the fair value of the Company's October 27, 2013 open contracts by $13.4 million, which in turn would lower the Company's future cost of purchased hogs by a similar amount. Turkey and Hog Production Costs: The Company raises or contracts for live turkeys... -
Page 33
... of internal controls and the quality of ï¬nancial reporting. Management's Report on Internal Control Over Financial Reporting Management of Hormel Foods Corporation is responsible for establishing and maintaining adequate internal control over ï¬nancial reporting for the Company, as such term is... -
Page 34
... of Hormel Foods Corporation as of October 27, 2013 and October 28, 2012, and the related consolidated statements of operations, comprehensive income, changes in shareholders' investment, and cash ï¬,ows for each of the three years in the period ended October 27, 2013, and our report dated December... -
Page 35
...years in the period ended October 27, 2013, in conformity with U.S. generally accepted accounting principles. We also have audited, in accordance with the standards of the Public Company Accounting Oversight Board (United States), Hormel Foods Corporation's internal control over ï¬nancial reporting... -
Page 36
...issued - none Common stock, par value $.0293 a share - authorized 800,000,000 shares; issued 263,658,296 shares October 27, 2013 issued 263,044,280 shares October 28, 2012 Accumulated other comprehensive loss Retained earnings Hormel Foods Corporation Shareholders' Investment Noncontrolling Interest... -
Page 37
...Fiscal Year Ended (in thousands, except per share amounts) October 27, 2013 October 28, 2012 October 30, 2011 Net sales Cost of products sold Gross Proï¬t Selling... to noncontrolling interest Net Earnings Attributable to Hormel Foods Corporation Net Earnings Per Share: Basic Diluted Weighted... -
Page 38
... at October 31, 2010 Net earnings Other comprehensive income Purchases of common stock Stock-based compensation expense Exercise of stock options/ nonvested shares Shares retired Distribution to noncontrolling interest Declared cash dividends - $.51 per share Balance at October 30, 2011 Net earnings... -
Page 39
... Flows Fiscal Year Ended (in thousands) October 27, 2013 October 28, 2012 October 30, 2011 Operating Activities Net earnings Adjustments to reconcile to net cash provided by operating activities: Depreciation Amortization of intangibles Equity in earnings of afï¬liates, net of dividends Provision... -
Page 40
... requires management to make estimates and assumptions that affect the amounts reported in the ï¬nancial statements and accompanying notes. Actual results could differ from those estimates. Fiscal Year: The Company's ï¬scal year ends on the last Sunday in October. Fiscal years 2013, 2012, and 2011... -
Page 41
... Company's lower of cost or market inventory reserve are reï¬,ected in cost of products sold in the Consolidated Statements of Operations. Property, Plant and Equipment: Property, plant and equipment are stated at cost. The Company uses the straight-line method in computing depreciation. The annual... -
Page 42
... for discounts, returns, and allowances. Products are delivered upon receipt of customer purchase orders with acceptable terms, including price and collectability that is reasonably assured. The Company offers various sales incentives to customers and consumers. Incentives that are offered off... -
Page 43
...2013, the Company's Board of Directors authorized the repurchase of up to an additional 10,000,000 shares of its common stock with no expiration date. During ï¬scal 2013, 0.6 million shares at an average price of $42.54 were purchased under this new authorization. Supplemental Cash Flow Information... -
Page 44
... Company estimated the acquisition date fair values of the assets acquired and liabilities assumed, using independent appraisals and other analyses, For ï¬scal years 2013, 2012, and 2011, a total of 0.4 million, 2.2 million, and 0.7 million weighted-average outstanding stock options, respectively... -
Page 45
... 27, 2013, and October 28, 2012, are presented in the table below. The additions during the ï¬scal year ended October 27, 2013 are entirely due to the acquisition of the United States based SKIPPY® peanut butter business on January 31, 2013. Grocery Products Refrigerated Foods Specialty Foods... -
Page 46
...in thousands) Segment 2013 2012 2011 MegaMex Foods, LLC Foreign Joint Ventures Other Total Grocery Products International & Other Various $17,261 3,252 - $20,513 $ 35,762 2,929 - $ 38,691 $ 24,532 3,423 (1,198) $ 26,757 Dividends received from afï¬liates for the ï¬scal years ended October 27... -
Page 47
... for post-retirement health or welfare beneï¬ts. Beneï¬ts for retired employees vary for each group depending on respective retirement dates and applicable plan coverage in effect. Contribution requirements for retired employees are governed by the Retiree Health Care Payment Program and may... -
Page 48
... (in thousands) 2013 2012 Post-retirement Beneï¬ts 2013 2012 Change in plan assets: Fair value of plan assets at beginning of year Actual return on plan assets Employee contributions Employer contributions Beneï¬ts paid Fair value of plan assets at end of year Funded status at end of year $ 939... -
Page 49
... allocations for the Company's pension plan assets as of the plan measurement date are as follows: 2013 Asset Category Actual Target Range Actual 2012 Target Range Large Capitalization Equity Hormel Foods Corporation Stock Small Capitalization Equity International Equity Private Equity Total Equity... -
Page 50
... per year through 2023. 2014 2015 2016 2017 2018 2019 - 2023 $ 48,716 50,234 52,559 55,428 58,367 339,843 $ 20,502 20,849 20,977 20,943 20,994 101,459 The fair values of the deï¬ned beneï¬t pension plan investments as of October 27, 2013 and October 28, 2012, by... -
Page 51
...-backed securities pricing sources; municipal, domestic, and foreign securities, which are valued daily using institutional bond quote sources; and mutual funds invested in long-duration corporate bonds that are valued at the publicly available NAV of shares held by the pension plans at year-end... -
Page 52
...,847 9,316 478 1,812 215 $33,668 The Company has commitments totaling $85.0 million for the private equity investments within the pension plans, of which $42.1 million and $53.2 million remain unfunded at ï¬scal year end 2013 and 2012, respectively. These commitments include $27.1 million and $15... -
Page 53
...579) $ 20,085 In order to ensure a steady supply of hogs and turkeys, and to keep the cost of products stable, the Company has entered into contracts with producers for the purchase of hogs and turkeys at formula-based prices over periods up to 10 years. The Company has also entered into grow-out... -
Page 54
...: Fiscal Year Ended The Company issues stock options and nonvested shares as part of its stock incentive plans for employees and non-employee directors. The Company's policy is to grant options with the exercise price equal to the market price of the common stock on the date of grant. Options... -
Page 55
...: Fiscal Year Ended October 27, 2013 October 28, 2012 October 30, 2011 NOTE M DERIVATIVES AND HEDGING Weighted-average grant date fair value Fair value of nonvested shares granted Fair value of shares vested $ 35.42 $ 1,600 $ 1,824 $28.98 $1,369 $2,476 $25.11 $1,299 $ 751 The Company uses... -
Page 56
...program and to manage the Company's exposure to ï¬,uctuations in commodity markets and foreign currencies. The Company has not applied hedge accounting to these positions. All foreign exchange and options contracts were closed as of the end of the ï¬scal year. Additionally, during ï¬scal year 2013... -
Page 57
...)(4) Fiscal Year Ended Fair Value Hedges: Location on Consolidated Statements of Operations October 27, 2013 October 28, 2012 Gain/(Loss) Recognized in Earnings (Ineffective Portion)(3) (6) Fiscal Year Ended October 27, 2013 October 28, 2012 Commodity contracts Cost of products sold $ 6,067... -
Page 58
... market funds rated AAA, and other highly liquid investment accounts. As these investments have a maturity date of three months or less, the carrying value approximates fair value. The Company holds trading securities as part of a rabbi trust to fund certain supplemental executive retirement plans... -
Page 59
..., foodservice, and fresh product customers. The Specialty Foods segment includes the Diamond Crystal Brands, Century Foods International, and Hormel Specialty Products operating segments. This segment consists of the packaging and sale of private label shelf stable products, nutritional products... -
Page 60
..., would report the operating proï¬t and other ï¬nancial information shown below. (in thousands) 2013 2012 2011 (in thousands) 2013 2012 2011 Assets Grocery Products Refrigerated Foods Jennie-O Turkey Store Specialty Foods International & Other Corporate Total Additions to Property, Plant and... -
Page 61
... three ï¬scal years are as follows: Fiscal Year Ended (in thousands) October 27, 2013 October 28, 2012 October 30, 2011 In ï¬scal 2013, sales to Wal-Mart Stores, Inc. (Wal-Mart) represented $1.33 billion or 13.9 percent of the Company's consolidated revenues (measured as gross sales less returns... -
Page 62
... of an account number and authentication ID. Information is available 24 hours per day, 7 days a week. If you are interested, you may use the website www.shareowneronline.com and access "Sign Up Now!" to arrange for setup. DIVIDEND REINVESTMENT PLAN Hormel Foods Corporation's common stock is traded... -
Page 63
...copy will be available free upon request via email, mail, or by calling (507) 437-5571. ANNUAL MEETING Inquiries regarding products of Hormel Foods Corporation should be addressed: Consumer Response Hormel Foods Corporation 1 Hormel Place Austin, MN 55912-3680 or call 1-800-523-4635 TRADEMARKS The... -
Page 64
...Ourada Vice President, Foodservice Sales (effective 10/28/2013) Donald H. Kremin Group Vice President, Specialty Foods Bryan D. Farnsworth Vice President, Quality Management James R. Schroeder Vice President, Engineering Glenn R. Leitch Group Vice President; President, Jennie-O Turkey Store, Inc... -
Page 65
... Ofï¬cer, Monsanto Company Director since October 2007 Jody H. Feragen Executive Vice President and Chief Financial Ofï¬cer Director since October 2007 Glenn S. Forbes, M.D. Retired Executive Board Chair and Emeritus Physician, Mayo Clinic Director since September 2011 Stephen M. Lacy Chairman... -
Page 66
... in its category. Each Hormel® Cure 81® ham bears the signature of our Curemaster, verifying its conformance to strict integrity and quality standards. S erving suggestion E Printed on recycled paper. Please recycle. Hormel Foods Corporation 1 Hormel Place Austin, MN 55912-3680 Cover and pages...