HollyFrontier 2014 Annual Report Download - page 8
Download and view the complete annual report
Please find page 8 of the 2014 HollyFrontier annual report below. You can navigate through the pages in the report by either clicking on the pages listed below, or by using the keyword search tool below to find specific information within the annual report.-
 1
1 -
 2
2 -
 3
3 -
 4
4 -
 5
5 -
 6
6 -
 7
7 -
 8
8 -
 9
9 -
 10
10 -
 11
11 -
 12
12 -
 13
13 -
 14
14 -
 15
15 -
 16
16 -
 17
17 -
 18
18 -
 19
19 -
20
-
21
-
22
-
23
-
24
-
25
-
26
-
27
-
28
-
29
-
30
-
31
-
32
-
33
-
34
-
35
-
36
-
37
-
38
-
39
-
40
-
41
-
42
-
43
-
44
-
45
-
46
-
47
-
48
-
49
-
50
-
51
-
52
-
53
-
54
-
55
-
56
-
57
-
58
-
59
-
60
-
61
-
62
-
63
-
64
-
65
-
66
-
67
-
68
-
69
-
70
-
71
-
72
-
73
-
74
-
75
-
76
-
77
-
78
-
79
-
80
-
81
-
82
-
83
-
84
-
85
-
86
-
87
-
88
-
89
-
90
-
91
-
92
-
93
-
94
-
95
-
96
-
97
-
98
-
99
-
100
-
101
-
102
-
103
-
104
-
105
-
106
-
107
-
108
-
109
-
110
-
111
-
112
-
113
-
114
-
115
-
116
-
117
-
118
-
119
-
120
-
121
-
122
 |
 |

10 11 12 13 14
8,323
15,440
20,091
20,161
19,764
10 11 12 13 14
3,050
9,576
10,329
10,057
9,231
10 11 12 13 14
104
1,023
1,727
736
281
10 11 12 13 14
226
332
443
414
425
4 HollyFrontier Corporation 2014 Annual Report
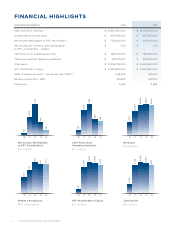
FINANCIAL HIGHLIGHTS
YEAR ENDED DECEMBER 31 2013 2014
Sales and other revenues $ 20,160,560,000 $ 19,764,327,000
Income before income taxes $ 1,159,399,000 $ 467,500,000
Net income attributable to HFC stockholders $ 735,842,000 $ 281,292,000
Net income per common share attributable $ 3.64 $ 1.42
to HFC stockholders – diluted
Cash flows from operating activities $ 869,174,000 $ 758,596,000
Cash flows used for capital expenditures $ 425,127,000 $ 564,821,000
Total assets $ 10,056,739,000 $ 9,230,640,000
HFC stockholders’ equity $ 5,999,620,000 $ 5,523,584,000
Sales of refined products – barrels per day (“BPD”) 446,390 461,640
Refinery production – BPD 413,820 425,010
Employees 2,662 2,686
Revenues
$ in millions
Net Income Attributable
to HFC Stockholders
$ in millions
10 11 12 13 14
283
1,338
1,663
869
759
10 11 12 13 14
697
5,204
6,053
6,000
5,524
Cash Flows from
Operating Activities
$ in millions
Total Assets
$ in millions
HFC Stockholders’ Equity
$ in millions
Refinery Production
BPD in thousands