HollyFrontier 2014 Annual Report Download - page 5
Download and view the complete annual report
Please find page 5 of the 2014 HollyFrontier annual report below. You can navigate through the pages in the report by either clicking on the pages listed below, or by using the keyword search tool below to find specific information within the annual report.-
 1
1 -
 2
2 -
 3
3 -
 4
4 -
 5
5 -
 6
6 -
 7
7 -
 8
8 -
 9
9 -
 10
10 -
 11
11 -
 12
12 -
 13
13 -
 14
14 -
 15
15 -
 16
16 -
17
-
18
-
19
-
20
-
21
-
22
-
23
-
24
-
25
-
26
-
27
-
28
-
29
-
30
-
31
-
32
-
33
-
34
-
35
-
36
-
37
-
38
-
39
-
40
-
41
-
42
-
43
-
44
-
45
-
46
-
47
-
48
-
49
-
50
-
51
-
52
-
53
-
54
-
55
-
56
-
57
-
58
-
59
-
60
-
61
-
62
-
63
-
64
-
65
-
66
-
67
-
68
-
69
-
70
-
71
-
72
-
73
-
74
-
75
-
76
-
77
-
78
-
79
-
80
-
81
-
82
-
83
-
84
-
85
-
86
-
87
-
88
-
89
-
90
-
91
-
92
-
93
-
94
-
95
-
96
-
97
-
98
-
99
-
100
-
101
-
102
-
103
-
104
-
105
-
106
-
107
-
108
-
109
-
110
-
111
-
112
-
113
-
114
-
115
-
116
-
117
-
118
-
119
-
120
-
121
-
122
 |
 |

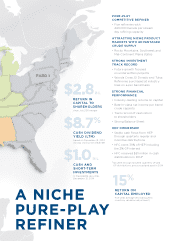
PADD I
A NICHE
PURE-PLAY
REFINER
PURE-PLAY
COMPETITIVE REFINER
• Five refineries with
443,000 barrels per stream
day refining capacity
ATTRACTIVE NICHE PRODUCT
MARKETS WITH ADVANTAGED
CRUDE SUPPLY
• Rocky Mountains, Southwest and
Mid-Continent Plains states
STRONG INVESTMENT
TRACK RECORD
• Future growth focused
on underwritten projects
• Woods Cross, El Dorado and Tulsa
Refineries purchased at industry
lows on a per barrel basis
STRONG FINANCIAL
PERFORMANCE
• Industry-leading returns on capital
• Best-in-class net income per barrel
crude capacity
• Track record of cash return
to shareholders
• Strong Balance Sheet
HEP OWNERSHIP
• Stable cash flows from HEP
through quarterly regular and
incentive distributions
• HFC owns 39% of HEP including
the 2% GP interest
• HFC received $81 million in cash
distributions in 2014*
* Q4 2013 through Q3 2014 quarterly LP and
GP distributions, announced and paid in 2014
RETURN ON
CAPITAL EMPLOYED
Five-year average (excluding 2014
inventory valuation adjustment)
15%
RETURN IN
CAPITAL TO
SHAREHOLDERS
since July 2011 merger
$2.8 BIL
$8.7%
CASH DIVIDEND
YIELD (LTM)
based on December 31, 2014
closing stock price of $37.48
$1.0 BIL
CASH AND
SHORT-TERM
INVESTMENTS
in marketable securities
December 31, 2014