HollyFrontier 2014 Annual Report Download - page 6
Download and view the complete annual report
Please find page 6 of the 2014 HollyFrontier annual report below. You can navigate through the pages in the report by either clicking on the pages listed below, or by using the keyword search tool below to find specific information within the annual report.-
 1
1 -
 2
2 -
 3
3 -
 4
4 -
 5
5 -
 6
6 -
 7
7 -
 8
8 -
 9
9 -
 10
10 -
 11
11 -
 12
12 -
 13
13 -
 14
14 -
 15
15 -
 16
16 -
 17
17 -
18
-
19
-
20
-
21
-
22
-
23
-
24
-
25
-
26
-
27
-
28
-
29
-
30
-
31
-
32
-
33
-
34
-
35
-
36
-
37
-
38
-
39
-
40
-
41
-
42
-
43
-
44
-
45
-
46
-
47
-
48
-
49
-
50
-
51
-
52
-
53
-
54
-
55
-
56
-
57
-
58
-
59
-
60
-
61
-
62
-
63
-
64
-
65
-
66
-
67
-
68
-
69
-
70
-
71
-
72
-
73
-
74
-
75
-
76
-
77
-
78
-
79
-
80
-
81
-
82
-
83
-
84
-
85
-
86
-
87
-
88
-
89
-
90
-
91
-
92
-
93
-
94
-
95
-
96
-
97
-
98
-
99
-
100
-
101
-
102
-
103
-
104
-
105
-
106
-
107
-
108
-
109
-
110
-
111
-
112
-
113
-
114
-
115
-
116
-
117
-
118
-
119
-
120
-
121
-
122
 |
 |

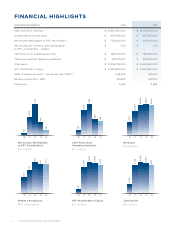
FINANCIAL RESULTS
In 2014 we achieved:
• Net Income attributable to HFC stockholders
of $281 million, $525 million excluding the lower
of cost or market “LOCM” adjustment
• Gross refining margins of $13.98 per produced barrel
• Operating cash flow of $758.6 million
• $1 billion in cash and short-term investments as
of December 31, 2014, compared to approximately
$187 million in long-term debt (exclusive of HEP debt)
• Over $780 million of capital returned to shareholders
In 2014, HollyFrontier delivered improved operational perfor-
mance across our refineries. We are seeing the benefit of
past and ongoing investments being made across our refining
system. Our consolidated refinery utilization rate in 2014 was
91.7%, above our five-year average utilization rate and nearly
a 5% improvement relative to 2013 levels due to a combination
of less planned maintenance activity and lower unplanned
downtime. In 2015 and beyond, we will continue to focus on
improving our operational efficiency, reliability, advantaged
crude access and refinery yield improvement.
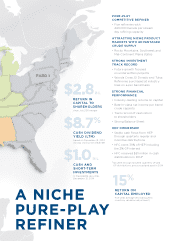
STRONG TRACK RECORD OF RETURNING
CAPITAL TO STOCKHOLDERS
HollyFrontier remains committed to generating shareholder
value by returning cash to shareholders. In 2014, HollyFrontier
returned over $780 million to stockholders through regular
quarterly dividends, special dividends and share repurchases.
On an annualized basis, the Company’s cash dividend yield was
8.7% as of year-end 2014. In February 2015, the Board of Direc-
tors authorized a new $500 million share repurchase program
reflecting our renewed focus on share repurchases to augment
our dividend program. Since completing the HollyFrontier
merger in July 2011, the Company has returned approximately
$2.8 billion in capital to stockholders.
INVESTING IN OUR OPERATIONS
In 2014, we invested $485 million in our facilities improving
our refining capabilities, safety and refinery reliability and
minimizing our environmental impact. Several of our investments
are scheduled to complete in 2015 and once operational will
augment HollyFrontier’s margins and drive sustainable long-term
value. Our 2014 capital investment projects included:
2 HollyFrontier Corporation 2014 Annual Report
HollyFrontier Corporation reported
Net Income attributable to HollyFrontier
stockholders of $281 million, or
$525 million excluding a $397 million
non-cash, pre-tax charge for inventory
valuation adjustment. We were not
immune to commodity price volatility
in 2014, during which domestic
crude prices plummeted 46% and
the WTI/Brent crude differential
compressed 40%. Our reported
gross margin per barrel declined only
13% to $13.98 per barrel reflecting
our advantaged geographic location
close to inland crude production
and niche product markets.
DEAR STOCKHOLDERS