Henry Schein 2005 Annual Report Download - page 7
Download and view the complete annual report
Please find page 7 of the 2005 Henry Schein annual report below. You can navigate through the pages in the report by either clicking on the pages listed below, or by using the keyword search tool below to find specific information within the annual report.-
 1
1 -
 2
2 -
 3
3 -
 4
4 -
 5
5 -
 6
6 -
 7
7 -
 8
8 -
 9
9 -
 10
10 -
 11
11 -
 12
12 -
 13
13 -
 14
14 -
 15
15 -
 16
16 -
 17
17 -
 18
18 -
19
-
20
-
21
-
22
-
23
-
24
 |
 |

$1,000
$0
01 02 03 04 05
$2,000
$3,000
$4,000
$5,000
0%
2%
4%
6%
8%
01 03 04 05
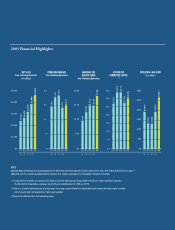
$2,413
$2,676
$3,194
$3,898
$4,636
5.8%
02
7.1%
7.3%
5.7%
6.1%
$0
$.50
$1.00
$1.50
$2.00
01 03 04 05
02
$1.25
$1.53
$1.50
$1.82
0%
35%
30%
25%
20%
15%
10%
5%
01 03 04 05
02
$0
$50
$100
$150
$200
$250
$300
01 03 04 05
02
$134.7
$132.5
$191.0
$265.1
$.97
27.2%
34.0%
34.1%
27.7%
30.9%
$190.9
(3) (3) (3) (3)
(1) (3) (3) (3) (3)
(1) (3) (3) (3) (3)
(1) (3) (3) (3) (3)
(1)
NOTES:
Operating Margin and Earnings from Continuing Operations Per Diluted Share have been adjusted to exclude certain one-time items. Refer to Non-GAAP Disclosures on page 17.
Additionally, refer to our annual consolidated financial statements for a complete presentation of our Consolidated Statements of Cash Flows.
(1) During 2004, we recorded a non-recurring $13.2 million pre-tax ($8.4 million post-tax) charge related to the Fluvirin®contract with Chiron Corporation.
The effect that this charge had on earnings per share for the year ended December 25, 2004 was $(0.10).
(2) Return on Committed Capital represents operating income over average committed capital (committed capital equals inventory plus trade accounts receivables
and net property, plant, and equipment less trade accounts payables).
(3) Adjusted to reflect the effects of discontinued operations.
2005 Financial Highlights
NET SALES
From Continuing Operations
($ in millions)
OPERATING MARGIN
From Continuing Operations
EARNINGS PER
DILUTED SHARE
From Continuing Operations
RETURN ON
COMMITTED CAPITAL
OPERATING CASH FLOW
($ in millions)
(2)