Health Net 1998 Annual Report Download - page 3
Download and view the complete annual report
Please find page 3 of the 1998 Health Net annual report below. You can navigate through the pages in the report by either clicking on the pages listed below, or by using the keyword search tool below to find specific information within the annual report.-
 1
1 -
 2
2 -
 3
3 -
 4
4 -
 5
5 -
 6
6 -
 7
7 -
 8
8 -
 9
9 -
 10
10 -
 11
11 -
 12
12 -
 13
13 -
 14
14 -
15
-
16
-
17
-
18
-
19
-
20
-
21
-
22
-
23
-
24
-
25
-
26
-
27
-
28
-
29
-
30
-
31
-
32
-
33
-
34
-
35
-
36
-
37
-
38
-
39
-
40
-
41
-
42
-
43
-
44
-
45
-
46
-
47
-
48
-
49
-
50
-
51
-
52
-
53
-
54
-
55
-
56
-
57
-
58
-
59
-
60
 |
 |

F O U N DAT IO N H EALTH SYST EM S, I N C. 1
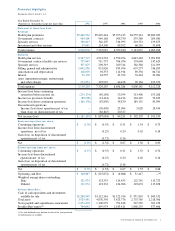
Financial Highlights
Foundation Health Systems, Inc.
Year Ended December 31,
(Amounts in thousands,except per share data) 1998 1997 1996 1995 1994
Statement of Operations Data:
R e v e n u e s
Health plan premiums $7,440,981 $5,829,444 $5,395,125 $4,557,214 $3,863,965
Government contracts 989,409 949,168 908,730 279,380 209,980
Specialty services 366,645 342,107 316,993 210,533 139,853
Investment and other income 99,041 114,300 88,392 66,510 51,698
Total revenues 8,896,076 7,235,019 6,709,240 5,113,637 4,265,496
E x p e n s e s
Health plan services 6,547,747 4,912,532 4,598,074 3,643,463 3,091,890
Government contracts health care services 757,047 711,757 706,076 174,040 147,629
Specialty services 307,675 290,319 289,744 182,380 121,299
Selling, general and administrative 1,042,556 851,826 859,996 657,275 536,209
Amortization and depreciation 128,093 98,353 112,916 89,356 66,741
Interest 92,159 63,555 45,372 33,463 23,081
Asset impairment,merger, restructuring
and other charges 274,953 395,925 44,108 20,164 125,379
Total expenses 9,150,230 7,324,267 6,656,286 4,800,141 4,112,228
Income (loss) from continuing
operations before income tax (254,154) (89,248) 52,954 313,496 153,268
Income tax provision (benefit) (88,996) (21,418) 14,124 124,345 70,169
Income (loss) from continuing operations (165,158) (67,830) 38,830 189,151 83,099
Discontinued operations:
Income (loss) from operations,net of tax –(30,409) 25,084 3,028 18,434
Gain (loss) on disposition,net of tax –(88,845) 20,317
Net income (loss) $ (165,158) $ (187,084) $ 84,231 $ 192,179 $ 101,533
Basic ear nings (loss) per share :
Continuing operations $ (1.35) $ (0.55) $ 0.31 $ 1.54 $ 0.73
Income (loss) from discontinued
operations, net of tax (0.25) 0.20 0.02 0.16
Gain (loss) on disposition of discontinued
operations,net of tax (0.72) 0.16
Net $ (1.35) $ (1.52) $ 0.67 $ 1.56 $ 0.89
Diluted earnings ( loss) per share :
Continuing operations $ (1.35) $ (0.55) $ 0.31 $ 1.53 $ 0.72
Income (loss) from discontinued
operations,net of tax (0.25) 0.20 0.02 0.16
Gain (loss) on disposition of discontinued
operations,net of tax (0.72) 0.16
Net $ (1.35) $ (1.52) $ 0.67 $ 1.55 $ 0.88
Operating cash flow $ 100,867 $ (125,872) $ (6,666) $ 51,417 –(ii)
Weighted average shares outstanding:
Basic 121,974 123,333 124,453 122,741 113,723
Diluted 121,974 123,333 124,966 123,674 115,658
Bala nce Sheet Data:
Cash & cash equivalents and investments
available for sale $1,288,947 $1,112,361 $1,122,916 $ 871,818 $ 840,332
Total assets 3,929,541 4,076,350 3,423,776 2,733,765 2,218,506
Notes paya ble and capital leases– n o n c u rre n t 1,254,278 1,308,979 791,618 547,522 301,356
Stockholders’equity(i) 744,042 895,974 1,183,411 1,068,255 877,466
(i) No cash dividends were declared in each of the years presented.
(ii) Information not available.