Haier 2009 Annual Report Download - page 11
Download and view the complete annual report
Please find page 11 of the 2009 Haier annual report below. You can navigate through the pages in the report by either clicking on the pages listed below, or by using the keyword search tool below to find specific information within the annual report.-
 1
1 -
 2
2 -
 3
3 -
 4
4 -
 5
5 -
 6
6 -
 7
7 -
 8
8 -
 9
9 -
 10
10 -
 11
11 -
 12
12 -
 13
13 -
 14
14 -
 15
15 -
 16
16 -
 17
17 -
 18
18 -
 19
19 -
 20
20 -
 21
21 -
 22
22 -
23
-
24
-
25
-
26
-
27
-
28
-
29
-
30
-
31
-
32
-
33
-
34
-
35
-
36
-
37
-
38
-
39
-
40
-
41
-
42
-
43
-
44
-
45
-
46
-
47
-
48
-
49
-
50
-
51
-
52
-
53
-
54
-
55
-
56
-
57
-
58
-
59
-
60
-
61
-
62
-
63
-
64
-
65
-
66
-
67
-
68
-
69
-
70
-
71
-
72
-
73
-
74
-
75
-
76
-
77
-
78
-
79
-
80
-
81
-
82
-
83
-
84
-
85
-
86
-
87
-
88
-
89
-
90
-
91
-
92
-
93
-
94
-
95
-
96
-
97
-
98
-
99
-
100
-
101
-
102
-
103
-
104
-
105
-
106
-
107
-
108
-
109
-
110
-
111
-
112
-
113
-
114
-
115
-
116
-
117
-
118
-
119
-
120
-
121
-
122
-
123
-
124
-
125
-
126
-
127
-
128
-
129
-
130
-
131
-
132
-
133
-
134
-
135
-
136
-
137
-
138
-
139
-
140
-
141
-
142
-
143
-
144
-
145
-
146
-
147
-
148
-
149
-
150
-
151
-
152
-
153
-
154
-
155
-
156
-
157
-
158
-
159
-
160
-
161
-
162
-
163
-
164
 |
 |
海爾電器集團有限公司 9
15.4%
370,000,000420,000,000
136,000,000152,000,000
172.1%
1.1%
1.8%
ERP
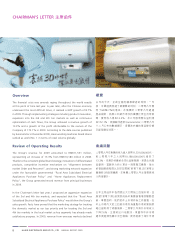
by 7.6%. Europe, ASEAN and the Central African market which are
the major places of export have not fully recovered from the economic
downturn, thus dragging down the performance of overseas markets.
In 2009, our sales growth in the domestic market reached 15.4%,
which effectively offset the adverse effects due to the tepid demand
from overseas markets.
Profit attributable to the owners of the Company for 2009 increased by
172.1% to RMB370 million (equivalent to HK$420 million) as compared
to RMB136 million (equivalent to HK$152 million) for 2008. The increase
in net profit is primarily attributable to a 1.1% growth in gross profit
margin and a 1.8% decrease of management expenses to revenue ratio
from 2008, benefiting from decrease in raw material prices as well as
the Group’s effort to optimise product mix, strengthen cost control and
improve profitability. Besides, the effective control over the administrative
expenses of the Group also contributed to the increased net profit this
year. The Group’s ERP information system is now functioning at relatively
mature stage and the related system and software costs were lowered in
2009. The administrative expenses decreased substantially as compared
with last year due to the higher operating efficiency after its business
process reengineering.
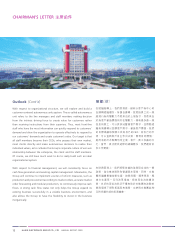
Outlook
Looking forward to 2010, we are still in the aftermath of the financial
crisis; oil and steel prices have already risen; the Chinese economy
structure is evolving, complicated by the various possibilities over the
implementation of macroeconomic policies; the emergence of the Internet
has impacted the conventional marketing model of home appliances. I
think if we fail to continue to manage innovation with an open mind, we
can hardly cope with the increasingly intense competitive environment
and the trends of change.