Freeport-McMoRan 2010 Annual Report Download - page 9
Download and view the complete annual report
Please find page 9 of the 2010 Freeport-McMoRan annual report below. You can navigate through the pages in the report by either clicking on the pages listed below, or by using the keyword search tool below to find specific information within the annual report.-
 1
1 -
 2
2 -
 3
3 -
 4
4 -
 5
5 -
 6
6 -
 7
7 -
 8
8 -
 9
9 -
 10
10 -
 11
11 -
 12
12 -
 13
13 -
 14
14 -
 15
15 -
 16
16 -
 17
17 -
 18
18 -
 19
19 -
 20
20 -
21
-
22
-
23
-
24
-
25
-
26
-
27
-
28
-
29
-
30
-
31
-
32
-
33
-
34
-
35
-
36
-
37
-
38
-
39
-
40
-
41
-
42
-
43
-
44
-
45
-
46
-
47
-
48
-
49
-
50
-
51
-
52
-
53
-
54
-
55
-
56
-
57
-
58
-
59
-
60
-
61
-
62
-
63
-
64
-
65
-
66
-
67
-
68
-
69
-
70
-
71
-
72
-
73
-
74
-
75
-
76
-
77
-
78
-
79
-
80
-
81
-
82
-
83
-
84
-
85
-
86
-
87
-
88
-
89
-
90
-
91
-
92
-
93
-
94
-
95
-
96
-
97
-
98
-
99
-
100
-
101
-
102
-
103
-
104
-
105
-
106
-
107
-
108
-
109
-
110
-
111
-
112
-
113
-
114
 |
 |

FREEPORT-McMoRan COPPER & GOLD INC. 2010 Annual Report
7
FCX’s consolidated molybdenum sales totaled 67 million pounds at an average realized
price of $16.47 per pound in 2010, compared with 2009 sales of 58 million pounds
at an average realized price of $12.36 per pound. Higher molybdenum sales volumes
in 2010 reflected improved demand in the chemicals sector.
Consolidated sales volumes for 2011 are estimated to approximate 3.85 billion pounds
of copper, 1.4 million ounces of gold and 70 million pounds of molybdenum. Lower
copper sales from Indonesia as a result of mining in a lower grade section of the
Grasberg open pit are expected to be offset by increases from North America, primarily
reflecting increased mining rates at Morenci. Lower estimated gold sales volumes for
2011 are a result of lower ore grades at Grasberg.
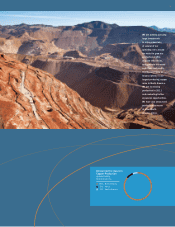
Consolidated Copper
Reserve Breakdown
35% North America
31% South America
27% Indonesia
7% Africa
Consolidated
Copper Sales
in billion lbs
2011e2010
2.0
4.0
3.0
1.0
Consolidated
Gold Sales
in million ozs
2011e2010
1.0
2.0
1.5
0.5
Consolidated
Molybdenum Sales
in million lbs
2011e2010
40
80
60
20