Freeport-McMoRan 2010 Annual Report Download - page 8
Download and view the complete annual report
Please find page 8 of the 2010 Freeport-McMoRan annual report below. You can navigate through the pages in the report by either clicking on the pages listed below, or by using the keyword search tool below to find specific information within the annual report.-
 1
1 -
 2
2 -
 3
3 -
 4
4 -
 5
5 -
 6
6 -
 7
7 -
 8
8 -
 9
9 -
 10
10 -
 11
11 -
 12
12 -
 13
13 -
 14
14 -
 15
15 -
 16
16 -
 17
17 -
 18
18 -
 19
19 -
20
-
21
-
22
-
23
-
24
-
25
-
26
-
27
-
28
-
29
-
30
-
31
-
32
-
33
-
34
-
35
-
36
-
37
-
38
-
39
-
40
-
41
-
42
-
43
-
44
-
45
-
46
-
47
-
48
-
49
-
50
-
51
-
52
-
53
-
54
-
55
-
56
-
57
-
58
-
59
-
60
-
61
-
62
-
63
-
64
-
65
-
66
-
67
-
68
-
69
-
70
-
71
-
72
-
73
-
74
-
75
-
76
-
77
-
78
-
79
-
80
-
81
-
82
-
83
-
84
-
85
-
86
-
87
-
88
-
89
-
90
-
91
-
92
-
93
-
94
-
95
-
96
-
97
-
98
-
99
-
100
-
101
-
102
-
103
-
104
-
105
-
106
-
107
-
108
-
109
-
110
-
111
-
112
-
113
-
114
 |
 |

6
2010 2011e
Cash Unit Costs (1)
Site Production & Delivery $ 1.40 $ 1.66
By-product Credits (0.81) (0.75)
Treatment Charges 0.15 0.14
Royalties 0.05 0.05
Unit Net Cash Costs $ 0.79 $ 1.10
(1) Estimates assume average prices of $4.25/lb for copper, $1,350/oz for gold, $15/lb for molybdenum and $14/lb for cobalt for 2011.
Quarterly unit costs will vary significantly with quarterly metal sales volumes.
Unit net cash costs for 2011 would change by approximately $0.02/lb for each $50/oz change in gold and for each $2/lb change in molybdenum.
Note: e=estimate.
Consolidated Unit Production Costs
per lb of copper
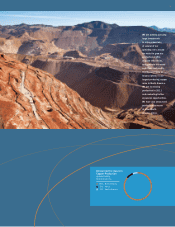
As the world’s largest
publicly traded copper
company, we provide
the metal that wires
the world (pictured:
copper cathode
produced at Morenci).
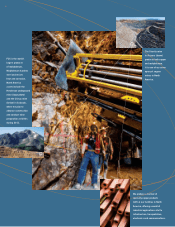
Consolidated Results
Freeport-McMoRan Copper & Gold Inc.’s (FCX) consolidated copper sales totaled
3.9 billion pounds at an average realized price of $3.59 per pound in 2010, compared
with 2009 sales of 4.1 billion pounds at an average realized price of $2.60 per pound.
Lower copper sales volumes in 2010 primarily resulted from lower ore grades at the
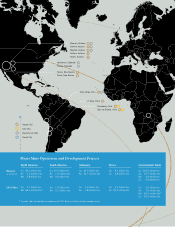
Grasberg open-pit mine in Indonesia and lower volumes from the North America copper
mines, partly offset by additional volumes from the Tenke Fungurume mine in Africa.
FCX’s consolidated gold sales totaled 1.9 million ounces at an average realized price of
$1,271 per ounce in 2010, compared with 2009 sales of 2.6 million ounces at an
average realized price of $993 per ounce. Lower gold sales volumes in 2010 primarily
reflected lower ore grades at Grasberg from planned mine sequencing.
Operational Overview