First Data 2008 Annual Report Download - page 13
Download and view the complete annual report
Please find page 13 of the 2008 First Data annual report below. You can navigate through the pages in the report by either clicking on the pages listed below, or by using the keyword search tool below to find specific information within the annual report.-
 1
1 -
2
-
 3
3 -
 4
4 -
 5
5 -
 6
6 -
 7
7 -
 8
8 -
 9
9 -
 10
10 -
 11
11 -
 12
12 -
 13
13 -
 14
14 -
 15
15 -
 16
16 -
 17
17 -
 18
18 -
 19
19 -
 20
20 -
 21
21 -
 22
22 -
 23
23 -
24
-
25
-
26
-
27
-
28
-
29
-
30
-
31
-
32
-
33
-
34
-
35
-
36
-
37
-
38
-
39
-
40
-
41
-
42
-
43
-
44
-
45
-
46
-
47
-
48
-
49
-
50
-
51
-
52
-
53
-
54
-
55
-
56
-
57
-
58
-
59
-
60
-
61
-
62
-
63
-
64
-
65
-
66
-
67
-
68
-
69
-
70
-
71
-
72
-
73
-
74
-
75
-
76
-
77
-
78
-
79
-
80
-
81
-
82
-
83
-
84
-
85
-
86
-
87
-
88
-
89
-
90
-
91
-
92
-
93
-
94
-
95
-
96
-
97
-
98
-
99
-
100
-
101
-
102
-
103
-
104
-
105
-
106
-
107
-
108
-
109
-
110
-
111
-
112
-
113
-
114
-
115
-
116
-
117
-
118
-
119
-
120
-
121
-
122
-
123
-
124
-
125
-
126
-
127
-
128
-
129
-
130
-
131
-
132
-
133
-
134
-
135
-
136
-
137
-
138
-
139
-
140
-
141
-
142
-
143
-
144
-
145
-
146
-
147
-
148
-
149
-
150
-
151
-
152
-
153
-
154
-
155
-
156
-
157
-
158
-
159
-
160
-
161
-
162
-
163
-
164
-
165
-
166
-
167
-
168
-
169
-
170
-
171
-
172
-
173
-
174
-
175
-
176
-
177
-
178
-
179
-
180
-
181
-
182
-
183
-
184
-
185
-
186
-
187
-
188
-
189
-
190
-
191
-
192
-
193
-
194
-
195
-
196
-
197
-
198
-
199
-
200
-
201
-
202
-
203
-
204
-
205
-
206
-
207
-
208
-
209
-
210
-
211
-
212
-
213
-
214
-
215
-
216
-
217
-
218
-
219
-
220
-
221
-
222
-
223
-
224
-
225
-
226
-
227
-
228
-
229
-
230
-
231
-
232
-
233
-
234
-
235
-
236
-
237
-
238
-
239
-
240
-
241
-
242
-
243
-
244
-
245
-
246
-
247
-
248
-
249
-
250
-
251
-
252
-
253
-
254
 |
 |

(1) – Operating profit, as a percentage of total segment and all other and corporate operating profit, for the predecessor period from January 1, 2007
through September 24, 2007 includes accelerated vesting of stock options and restricted stock awards and units and transaction costs related to the
merger of $265.2 million that were recognized in All Other and Corporate. The exclusion of these costs from the calculation would decrease
International's operating profit percentage shown above by approximately 3 percentage points for the predecessor period from January 1, 2007 through
September 24, 2007.
(2) – Operating profit and assets were impacted by purchase accounting in the successor period from September 25, 2007 through December 31, 2007 and
for the year ended December 31, 2008. Assets at December 31, 2008 were additionally impacted by a goodwill impairment recorded in the fourth
quarter of 2008 as described in Item 7, Management's Discussion and Analysis of Financial Condition and Results of Operations, of this Form 10-K.
The merchant acquiring and card issuing services provided by the International segment are similar in nature to the services described above in the
Merchant Services and Financial Services segments other than they include substantially all the services provided outside of the U.S. For a description of the
International segment's merchant acquiring and card issuing businesses refer to the Merchant Services and Financial Services segment descriptions provided
above.
International Pipeline
The account pipeline at December 31, 2008 was immaterial.
International Segment Competition and Seasonality
Competition and seasonality within the International segment is similar to that of the Merchant Services and Financial Services segments for the
respective product and service offerings and also includes third-party software providers. See discussions above. A noted difference from the U.S. operations
is that there are more and smaller competitors because of the International segment's global span.
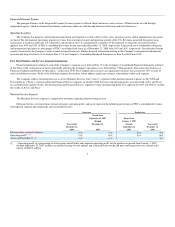
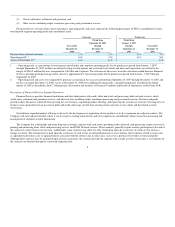
International Geographic Mix
The following countries accounted for more than 10% of the segment's revenues from external customers for the years ended December 31, 2008, 2007
and 2006, respectively:
Successor Predecessor
Year ended
December 31,
2008
Period from
September 25,
2007
through
December 31,
2007
Period from
January 1,
2007
through
September 24,
2007
Year ended
December 31,
2006
United Kingdom 18% 21% 22% 22%
Germany 17% 19% 20% 19%
Australia 11% 13% 13% 15%
No other individual foreign country accounted for more than 8% of the segment's revenues from external customers for the years ended December 31,
2008, 2007 and 2006, respectively. No individual foreign country was material to the Company's consolidated revenues.
International Significant Customers
No individual customer makes up more than 10% of the International segment revenue.
12