Fannie Mae 2014 Annual Report Download - page 9
Download and view the complete annual report
Please find page 9 of the 2014 Fannie Mae annual report below. You can navigate through the pages in the report by either clicking on the pages listed below, or by using the keyword search tool below to find specific information within the annual report.-
 1
1 -
 2
2 -
 3
3 -
 4
4 -
 5
5 -
 6
6 -
 7
7 -
 8
8 -
 9
9 -
 10
10 -
 11
11 -
 12
12 -
 13
13 -
 14
14 -
 15
15 -
 16
16 -
 17
17 -
 18
18 -
 19
19 -
 20
20 -
21
-
22
-
23
-
24
-
25
-
26
-
27
-
28
-
29
-
30
-
31
-
32
-
33
-
34
-
35
-
36
-
37
-
38
-
39
-
40
-
41
-
42
-
43
-
44
-
45
-
46
-
47
-
48
-
49
-
50
-
51
-
52
-
53
-
54
-
55
-
56
-
57
-
58
-
59
-
60
-
61
-
62
-
63
-
64
-
65
-
66
-
67
-
68
-
69
-
70
-
71
-
72
-
73
-
74
-
75
-
76
-
77
-
78
-
79
-
80
-
81
-
82
-
83
-
84
-
85
-
86
-
87
-
88
-
89
-
90
-
91
-
92
-
93
-
94
-
95
-
96
-
97
-
98
-
99
-
100
-
101
-
102
-
103
-
104
-
105
-
106
-
107
-
108
-
109
-
110
-
111
-
112
-
113
-
114
-
115
-
116
-
117
-
118
-
119
-
120
-
121
-
122
-
123
-
124
-
125
-
126
-
127
-
128
-
129
-
130
-
131
-
132
-
133
-
134
-
135
-
136
-
137
-
138
-
139
-
140
-
141
-
142
-
143
-
144
-
145
-
146
-
147
-
148
-
149
-
150
-
151
-
152
-
153
-
154
-
155
-
156
-
157
-
158
-
159
-
160
-
161
-
162
-
163
-
164
-
165
-
166
-
167
-
168
-
169
-
170
-
171
-
172
-
173
-
174
-
175
-
176
-
177
-
178
-
179
-
180
-
181
-
182
-
183
-
184
-
185
-
186
-
187
-
188
-
189
-
190
-
191
-
192
-
193
-
194
-
195
-
196
-
197
-
198
-
199
-
200
-
201
-
202
-
203
-
204
-
205
-
206
-
207
-
208
-
209
-
210
-
211
-
212
-
213
-
214
-
215
-
216
-
217
-
218
-
219
-
220
-
221
-
222
-
223
-
224
-
225
-
226
-
227
-
228
-
229
-
230
-
231
-
232
-
233
-
234
-
235
-
236
-
237
-
238
-
239
-
240
-
241
-
242
-
243
-
244
-
245
-
246
-
247
-
248
-
249
-
250
-
251
-
252
-
253
-
254
-
255
-
256
-
257
-
258
-
259
-
260
-
261
-
262
-
263
-
264
-
265
-
266
-
267
-
268
-
269
-
270
-
271
-
272
-
273
-
274
-
275
-
276
-
277
-
278
-
279
-
280
-
281
-
282
-
283
-
284
-
285
-
286
-
287
-
288
-
289
-
290
-
291
-
292
-
293
-
294
-
295
-
296
-
297
-
298
-
299
-
300
-
301
-
302
-
303
-
304
-
305
-
306
-
307
-
308
-
309
-
310
-
311
-
312
-
313
-
314
-
315
-
316
-
317
 |
 |
4
our net portfolio. See “MD&A—Risk Management—Market Risk Management, Including Interest Rate Risk Management”
for more information. In addition, our credit-related income or expense can vary substantially from period to period primarily
due to changes in home prices, borrower payment behavior and economic conditions.
See “MD&A—Consolidated Results of Operations” for more information on our results.
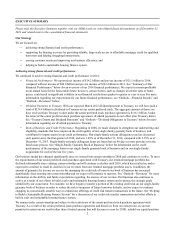
Net Worth
Our net worth decreased to $3.7 billion as of December 31, 2014 from $9.6 billion as of December 31, 2013 primarily due to
our payments to Treasury of $20.6 billion in senior preferred stock dividends, partially offset by our comprehensive income
of $14.7 billion during 2014.
The dividend amount payable to Treasury on the senior preferred stock for each dividend period from January 1, 2013
through and including December 31, 2017 is the amount, if any, by which our net worth as of the end of the immediately
preceding fiscal quarter exceeds an applicable capital reserve amount. The capital reserve amount was $2.4 billion for
dividend periods in 2014 and further decreased to $1.8 billion for dividend periods in 2015. Our expected dividend payment
of $1.9 billion for the first quarter of 2015 is calculated based on our net worth of $3.7 billion as of December 31, 2014 less
the applicable capital reserve amount of $1.8 billion.
Single-Family Guaranty Book of Business
Credit Performance
We continued to achieve strong credit performance in 2014. In addition to acquiring loans with strong credit profiles, as we
discuss below in “Recently Acquired Single-Family Loans,” we continued to execute on our strategies for reducing credit
losses, such as helping eligible Fannie Mae borrowers with high loan-to-value (“LTV”) ratio loans refinance into more
sustainable loans through the Obama Administration’s Home Affordable Refinance Program® (“HARP®”), offering
borrowers loan modifications that can significantly reduce their monthly payments, pursuing foreclosure alternatives and
managing our real estate owned (“REO”) inventory to appropriately manage costs and maximize sales proceeds. As we work
to reduce credit losses, we also seek to assist struggling homeowners, help stabilize communities and support the housing
market.
Table 1 presents information for each of the last three years about the credit performance of mortgage loans in our single-
family guaranty book of business and our workouts. The term “workouts” refers to both home retention solutions (loan
modifications and other solutions that enable a borrower to stay in his or her home) and foreclosure alternatives (short sales
and deeds-in-lieu of foreclosure). The workout information in Table 1 does not reflect repayment plans and forbearances that
have been initiated but not completed, nor does it reflect trial modifications that have not become permanent.