Eversource 2010 Annual Report Download - page 3
Download and view the complete annual report
Please find page 3 of the 2010 Eversource annual report below. You can navigate through the pages in the report by either clicking on the pages listed below, or by using the keyword search tool below to find specific information within the annual report.-
 1
1 -
 2
2 -
 3
3 -
 4
4 -
 5
5 -
 6
6 -
 7
7 -
 8
8 -
 9
9 -
 10
10 -
 11
11 -
 12
12 -
 13
13 -
 14
14 -
15
-
16
-
17
-
18
-
19
-
20
-
21
-
22
-
23
-
24
-
25
-
26
-
27
-
28
-
29
-
30
-
31
-
32
-
33
-
34
-
35
-
36
-
37
-
38
-
39
-
40
-
41
-
42
-
43
-
44
-
45
-
46
-
47
-
48
-
49
-
50
-
51
-
52
-
53
-
54
-
55
-
56
-
57
-
58
-
59
-
60
-
61
-
62
-
63
-
64
-
65
-
66
-
67
-
68
-
69
-
70
-
71
-
72
-
73
-
74
-
75
-
76
-
77
-
78
-
79
-
80
-
81
-
82
-
83
-
84
-
85
-
86
-
87
-
88
-
89
-
90
-
91
-
92
-
93
-
94
-
95
-
96
-
97
-
98
-
99
-
100
-
101
-
102
-
103
-
104
-
105
-
106
-
107
-
108
-
109
-
110
-
111
-
112
-
113
-
114
-
115
-
116
-
117
-
118
-
119
-
120
-
121
-
122
-
123
-
124
-
125
-
126
-
127
-
128
-
129
-
130
-
131
-
132
-
133
-
134
-
135
-
136
-
137
-
138
-
139
-
140
-
141
-
142
-
143
-
144
-
145
-
146
-
147
-
148
-
149
-
150
-
151
-
152
-
153
-
154
-
155
-
156
-
157
-
158
-
159
-
160
-
161
-
162
-
163
-
164
 |
 |

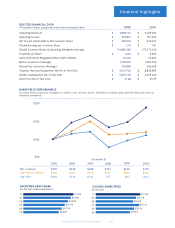
financial highlights
DIVIDENDS PAID/SHARE
For the Years Ended December 31,
10
09
08
07
06
05
$0.825
$0.775
$0.725
$0.675
CLOSING SHARE PRICE
At Year End
10
09
08
07
06
05
$24.06
$28.16
$19.69
SELECTED FINANCIAL DATA
(Thousands of dollars, except share information and statistical data) 2010 2009
Operating Revenues $ 4,898,167 $ 5,439,430
Operating Income $ 799,891 $ 751,375
Net Income Attributable to NU Common Shares $ 387,949 $ 330,033
Diluted Earnings per Common Share $ 2.19 $ 1.91
Diluted Common Shares Outstanding (Weighted Average) 176,885,387 172,717,246
Dividends per Share $ 1.025 $ 0.950
Sales of Electricity (Regulated Retail, KWH-millions) 34,230 33,645
Electric Customers (Average) 1,909,905 1,900,776
Natural Gas Customers (Average) 205,885 206,438
Property, Plant and Equipment, Net (As of Year End) $ 9,567,726 $ 8,839,965
Market Capitalization (As of Year End) $ 5,625,165 $ 4,529,240
Share Price (As of Year End) $ 31.88 $ 25.79
December 31,
NU Common $100 $148 $168 $134 $149 $191
S&P Electric Utilities $100 $123 $152 $113 $116 $120
S&P 500 $100 $116 $122 $77 $97 $112
2005 2006 2007 2008 2009 2010
SHARE PRICE PERFORMANCE
(Assumes $100 invested on December 31, 2005, in NU common shares, S&P Electric Utilities Index and S&P 500 Index with all
dividends reinvested)
$31.88$1.025
$0.950 $25.79
$31.31
northeast utilities 2010 annual report | one
$200
$150
$100
$50