Equifax 2010 Annual Report Download - page 15
Download and view the complete annual report
Please find page 15 of the 2010 Equifax annual report below. You can navigate through the pages in the report by either clicking on the pages listed below, or by using the keyword search tool below to find specific information within the annual report.-
 1
1 -
2
-
3
-
4
-
 5
5 -
 6
6 -
 7
7 -
 8
8 -
 9
9 -
 10
10 -
 11
11 -
 12
12 -
 13
13 -
 14
14 -
 15
15 -
 16
16 -
 17
17 -
 18
18 -
 19
19 -
 20
20 -
 21
21 -
 22
22 -
 23
23 -
 24
24 -
 25
25 -
26
-
27
-
28
-
29
-
30
-
31
-
32
-
33
-
34
-
35
-
36
-
37
-
38
-
39
-
40
-
41
-
42
-
43
-
44
-
45
-
46
-
47
-
48
-
49
-
50
-
51
-
52
-
53
-
54
-
55
-
56
-
57
-
58
-
59
-
60
-
61
-
62
-
63
-
64
-
65
-
66
-
67
-
68
-
69
-
70
-
71
-
72
-
73
-
74
-
75
-
76
-
77
-
78
-
79
-
80
 |
 |

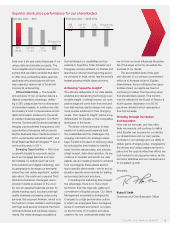
Key Performance Indicators. Management focuses on a variety of
key indicators to monitor operating and financial performance. These
performance indicators include measurements of operating revenue,
change in operating revenue, operating income, operating margin,
net income, diluted earnings per share, cash provided by operating
activities and capital expenditures. The key performance indicators
for the twelve months ended December 31, 2010, 2009 and 2008,
include the following:
Key Performance Indicators
Twelve Months Ended
December 31,
(Dollars in millions,
except per share data) 2010 2009 2008
Operating revenue $1,859.5 $1,716.0 $1,813.6
Operating revenue change 8% -5% 6%
Operating income $ 430.0 $ 381.8 $ 439.0
Operating margin 23.1% 22.2% 24.2%
Net income attributable
to Equifax $ 266.7 $ 233.9 $ 272.8
Diluted earnings per share
from continuing
operations $ 1.86 $ 1.70 $ 1.91
Cash provided by
operating activities $ 352.6 $ 418.4 $ 448.1
Capital expenditures $ 99.8 $ 70.7 $ 110.5
Operational and Financial Highlights.
• On April 23, 2010, we sold our APPRO loan origination software
business (‘‘APPRO’’) for approximately $72 million. On July 1,
2010, we sold the assets of our Direct Marketing Services division
(‘‘DMS’’) for approximately $117 million.
• On October 1, 2010, we acquired Anakam, Inc., a provider of
large-scale, software-based, multi-factor authentication solutions
for $64.3 million. Anakam is part of our U.S. Consumer Information
Solutions segment.
• We repurchased 5.2 million shares of our common stock on the
open market for $167.5 million during 2010.
• Total debt was $1.0 billion at December 31, 2010, a decrease of
$174.5 million from December 31, 2009.
Business Environment, Company Outlook and Strategy
Consumer and small business lending activity, which is one of the
drivers of demand for our services, has stabilized in most markets
around the world, but in most cases is not yet showing significant
growth. We expect growth in consumer lending to continue to lag the
general economic recovery, particularly in the more mature markets.
In addition, new financial regulations are increasing the compliance
requirements for many of our customers, introducing new challenges
and opportunities in the marketing of our product and service offer-
ings to financial institutions. In an effort to respond to these
challenges, we have focused on the following initiatives and activities:
• We are further diversifying our revenues by pursuing and investing
in key strategic initiatives including new product innovation, dif-
ferentiated decisioning solutions and analytics leveraging our
diverse data assets and technology.
• We have reorganized our sales force and have key customer
teams dedicated to our largest accounts.
• We have divested two product lines that were considered non-
strategic, APPRO loan origination software and Direct
Marketing Services.
• We continue to acquire new data assets and technologies and
pursue international expansion.
• We continue to focus on managing our expenses through the use
of LEAN, Work Out and other process improvement initiatives.
For 2011, the operating environment will continue to create chal-
lenges for the marketing and growth of our traditional products and
services, but will also create new opportunities for our more recently
developed products which leverage our diverse data assets, analyti-
cal capabilities and technology to improve customers’ decisioning
capabilities and risk management activities. In 2011, we expect
improvements in the credit economy to be modest and therefore not
contribute measurably to organic growth. However, we do expect to
derive organic growth through our new product offerings and from
the momentum we achieved as a result of our performance in 2010.
EQUIFAX 2010 ANNUAL REPORT 13
13