Epson 2015 Annual Report Download - page 7
Download and view the complete annual report
Please find page 7 of the 2015 Epson annual report below. You can navigate through the pages in the report by either clicking on the pages listed below, or by using the keyword search tool below to find specific information within the annual report.-
 1
1 -
 2
2 -
 3
3 -
 4
4 -
 5
5 -
 6
6 -
 7
7 -
 8
8 -
 9
9 -
 10
10 -
 11
11 -
 12
12 -
 13
13 -
 14
14 -
 15
15 -
 16
16 -
 17
17 -
 18
18 -
19
-
20
-
21
-
22
-
23
-
24
-
25
-
26
-
27
-
28
-
29
-
30
-
31
-
32
-
33
-
34
-
35
-
36
-
37
-
38
-
39
-
40
-
41
-
42
-
43
-
44
-
45
-
46
-
47
-
48
-
49
-
50
-
51
-
52
-
53
-
54
-
55
-
56
-
57
-
58
-
59
-
60
-
61
-
62
-
63
-
64
-
65
-
66
-
67
-
68
-
69
-
70
-
71
-
72
-
73
-
74
-
75
-
76
-
77
-
78
-
79
-
80
-
81
-
82
-
83
-
84
-
85
-
86
-
87
-
88
-
89
-
90
-
91
-
92
-
93
-
94
-
95
-
96
-
97
-
98
-
99
-
100
-
101
-
102
-
103
-
104
-
105
-
106
-
107
-
108
-
109
-
110
-
111
-
112
-
113
-
114
-
115
-
116
-
117
-
118
-
119
-
120
-
121
-
122
-
123
-
124
-
125
-
126
-
127
 |
 |

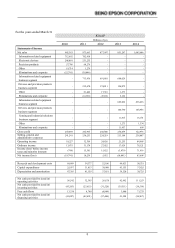
6
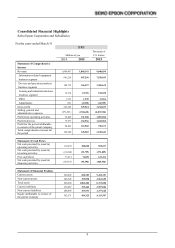
JGAAP
Millions of yen
2010
2011
2012
2013
2014
Balance Sheet
Current assets
596,210
543,530
487,190
519,457
602,452
Property, plant and equipment (net of
accumulated depreciation)
225,354 213,623 213,086 217,388 216,170
Total assets
870,090
798,229
740,769
778,547
865,872
Current liabilities
328,652
315,422
313,314
326,688
313,636
Non-current liabilities
258,574
211,999
179,314
193,052
200,505
Net assets
282,864
270,808
248,140
258,806
351,730
Number of Employees
Information-related equipment
45,863
44,711
-
-
-
Electronic devices
22,439
20,659
-
-
-
Precision products
5,839
5,985
-
-
-
Information-related equipment
business segment
- - 55,841 50,823 55,104
Devices and precision products
business segment - - 16,101 13,859 13,723
Sensing and industrial solutions
business segment
- - - - 1,197
Other
590
245
249
241
252
Corporate
3,206
2,951
3,112
3,838
2,895
Total
77,936
74,551
75,303
68,761
73,171
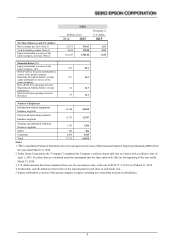
Per Share Data (yen and U.S. dollars)
Net income (loss) (Note 1)
(99.34)
51.25
26.22
(56.41)
233.94
Cash dividends (Note 3)
7.00
20.00
26.00
20.00
50.00
Shareholders’ equity (Note1)
1,407.92
1,347.71
1,377.60
1,435.20
976.41
Financial Ratios (%)
Shareholders’ equity ratio
32.3
33.7
33.3
33.0
40.3
ROE (net income (loss)/average
shareholders’ equity at beginning and
end of year)
(6.8) 3.7 2.0 (4.0) 27.6
ROA (ordinary income/average total
assets at beginning and end of year)
1.6 3.7 3.5 2.3 9.5
ROS (operating income/net sales)
1.8
3.4
2.8
2.5
8.5
Notes
1. Seiko Epson Corporation (the “Company”) completed the Company’s ordinary shares split into two shares with an effective date of
April 1, 2015. Per share data are calculated under the assumption that the share splits took effect at the beginning of the year ended
March 31, 2014.
2. Ordinary income is a common item on financial statements in Japan, which is calculated by adding to or subtracting from operating
income items such as interest income, rent income, interest expenses and foreign exchange gains or losses.
3. In this table, cash dividends per share refers to the amount paid for each share in each fiscal year.
4. Shareholders’ equity is net assets excluding minority interests.