Epson 2015 Annual Report Download - page 4
Download and view the complete annual report
Please find page 4 of the 2015 Epson annual report below. You can navigate through the pages in the report by either clicking on the pages listed below, or by using the keyword search tool below to find specific information within the annual report.-
 1
1 -
 2
2 -
 3
3 -
 4
4 -
 5
5 -
 6
6 -
 7
7 -
 8
8 -
 9
9 -
 10
10 -
 11
11 -
 12
12 -
 13
13 -
 14
14 -
 15
15 -
16
-
17
-
18
-
19
-
20
-
21
-
22
-
23
-
24
-
25
-
26
-
27
-
28
-
29
-
30
-
31
-
32
-
33
-
34
-
35
-
36
-
37
-
38
-
39
-
40
-
41
-
42
-
43
-
44
-
45
-
46
-
47
-
48
-
49
-
50
-
51
-
52
-
53
-
54
-
55
-
56
-
57
-
58
-
59
-
60
-
61
-
62
-
63
-
64
-
65
-
66
-
67
-
68
-
69
-
70
-
71
-
72
-
73
-
74
-
75
-
76
-
77
-
78
-
79
-
80
-
81
-
82
-
83
-
84
-
85
-
86
-
87
-
88
-
89
-
90
-
91
-
92
-
93
-
94
-
95
-
96
-
97
-
98
-
99
-
100
-
101
-
102
-
103
-
104
-
105
-
106
-
107
-
108
-
109
-
110
-
111
-
112
-
113
-
114
-
115
-
116
-
117
-
118
-
119
-
120
-
121
-
122
-
123
-
124
-
125
-
126
-
127
 |
 |

3
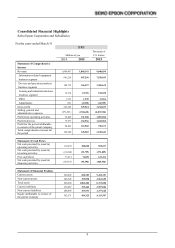
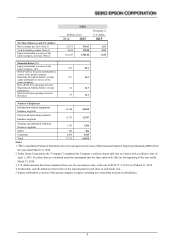
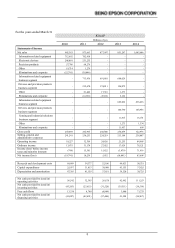
Consolidated Financial Highlights
Seiko Epson Corporation and Subsidiaries
For the years ended March 31
IFRS
Millions of yen
Thousands of
U.S. dollars
2014
2015
2015
Statement of Comprehensive
Income
Revenue
1,008,407
1,086,341
9,040,034
Information-related equipment
business segment
841,228 907,296 7,550,105
Devices and precision products
business segment
148,779 156,297 1,300,632
Sensing and industrial solutions
business segment
16,174 23,396 194,690
Other
1,333
1,390
11,566
Adjustments
891
(2,038)
(16,959)
Gross profit
362,589
395,924
3,294,699
Selling, general and
administrative expenses
(272,501) (294,648) (2,451,926)
Profit from operating activities
79,549
131,380
1,093,284
Profit before tax
77,977
132,536
1,102,904
Profit for the period attributable
to owners of the parent company
84,203 112,560 936,673
Total comprehensive income for
the period
120,480 145,483 1,210,643
Statement of Cash Flows
Net cash provided by (used in)
operating activities
114,859 108,828 905,617
Net cash provided by (used in)
investing activities
(41,244) (32,735) (272,405)
Free cash flows
73,615
76,093
633,212
Net cash provided by (used in)
financing activities
(56,567) (55,392) (460,946)
Statement of Financial Position
Current assets
560,645
650,383
5,412,191
Non-current assets 348,245 355,898 2,961,629
Total assets
908,890
1,006,282
8,373,820
Current liabilities 336,087 355,442 2,957,826
Non-current liabilities
208,045
153,531
1,277,624
Equity attributable to owners of
the parent company
362,371 494,325 4,113,547