Epson 2015 Annual Report Download - page 6
Download and view the complete annual report
Please find page 6 of the 2015 Epson annual report below. You can navigate through the pages in the report by either clicking on the pages listed below, or by using the keyword search tool below to find specific information within the annual report.-
 1
1 -
 2
2 -
 3
3 -
 4
4 -
 5
5 -
 6
6 -
 7
7 -
 8
8 -
 9
9 -
 10
10 -
 11
11 -
 12
12 -
 13
13 -
 14
14 -
 15
15 -
 16
16 -
 17
17 -
18
-
19
-
20
-
21
-
22
-
23
-
24
-
25
-
26
-
27
-
28
-
29
-
30
-
31
-
32
-
33
-
34
-
35
-
36
-
37
-
38
-
39
-
40
-
41
-
42
-
43
-
44
-
45
-
46
-
47
-
48
-
49
-
50
-
51
-
52
-
53
-
54
-
55
-
56
-
57
-
58
-
59
-
60
-
61
-
62
-
63
-
64
-
65
-
66
-
67
-
68
-
69
-
70
-
71
-
72
-
73
-
74
-
75
-
76
-
77
-
78
-
79
-
80
-
81
-
82
-
83
-
84
-
85
-
86
-
87
-
88
-
89
-
90
-
91
-
92
-
93
-
94
-
95
-
96
-
97
-
98
-
99
-
100
-
101
-
102
-
103
-
104
-
105
-
106
-
107
-
108
-
109
-
110
-
111
-
112
-
113
-
114
-
115
-
116
-
117
-
118
-
119
-
120
-
121
-
122
-
123
-
124
-
125
-
126
-
127
 |
 |

5
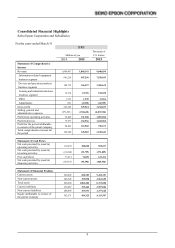
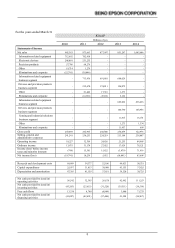
For the years ended March 31
JGAAP
Millions of yen
2010
2011
2012
2013
2014
Statements of Income
Net sales
985,363
973,663
877,997
851,297
1,003,606
Information-related equipment
712,692
702,918
-
-
-
Electronic devices
248,001
231,235
-
-
-
Precision products
57,746
68,276
-
-
-
Other
19,714
1,279
-
-
-
Eliminations and corporate
(52,791)
(30,046)
-
-
-
Information-related equipment
business segment
- 713,936 691,801 688,029 -
Devices and precision products
business segment
- 212,670 174,811 156,872 -
Other
-
61,446
17,316
1,273
-
Eliminations and corporate
-
(14,390)
(5,932)
5,122
-
Information-related equipment
business segment
- - - 685,862 836,436
Devices and precision products
business segment
- - - 140,790 148,956
Sensing and industrial solutions
business segment
- - - 11,413 16,181
Other
-
-
-
1,273
1,334
Eliminations and corporate
-
-
-
11,957
699
Gross profit
259,469
262,963
248,846
234,439
322,976
Selling, general and
administrative expenses
241,241 230,253 224,219 213,184 238,007
Operating income
18,227
32,709
24,626
21,255
84,968
Ordinary income
13,875
31,174
27,022
17,629
78,121
Income (loss) before income
taxes and minority interests
(799) 15,381 15,622 (3,479) 71,916
Net income (loss)
(19,791)
10,239
5,032
(10,091)
83,698
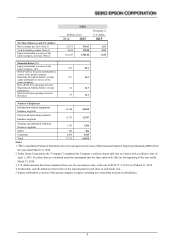
Research and development costs
68,849
54,377
52,106
49,923
50,531
Capital expenditures
25,937
31,813
38,908
43,155
37,825
Depreciation and amortization
47,395
41,159
37,651
39,320
38,725
Net cash provided by (used in)
operating activities
56,542 32,395 26,678 42,992 111,253
Net cash provided by (used in)
investing activities
(43,203) (23,615) (31,528) (39,511) (39,519)
Free cash flows
13,338
8,780
(4,849)
3,480
71,733
Net cash provided by (used in)
financing activities
(41,087) (42,691) (57,406) 21,298 (56,567)