Epson 2015 Annual Report Download - page 5
Download and view the complete annual report
Please find page 5 of the 2015 Epson annual report below. You can navigate through the pages in the report by either clicking on the pages listed below, or by using the keyword search tool below to find specific information within the annual report.-
 1
1 -
 2
2 -
 3
3 -
 4
4 -
 5
5 -
 6
6 -
 7
7 -
 8
8 -
 9
9 -
 10
10 -
 11
11 -
 12
12 -
 13
13 -
 14
14 -
 15
15 -
 16
16 -
17
-
18
-
19
-
20
-
21
-
22
-
23
-
24
-
25
-
26
-
27
-
28
-
29
-
30
-
31
-
32
-
33
-
34
-
35
-
36
-
37
-
38
-
39
-
40
-
41
-
42
-
43
-
44
-
45
-
46
-
47
-
48
-
49
-
50
-
51
-
52
-
53
-
54
-
55
-
56
-
57
-
58
-
59
-
60
-
61
-
62
-
63
-
64
-
65
-
66
-
67
-
68
-
69
-
70
-
71
-
72
-
73
-
74
-
75
-
76
-
77
-
78
-
79
-
80
-
81
-
82
-
83
-
84
-
85
-
86
-
87
-
88
-
89
-
90
-
91
-
92
-
93
-
94
-
95
-
96
-
97
-
98
-
99
-
100
-
101
-
102
-
103
-
104
-
105
-
106
-
107
-
108
-
109
-
110
-
111
-
112
-
113
-
114
-
115
-
116
-
117
-
118
-
119
-
120
-
121
-
122
-
123
-
124
-
125
-
126
-
127
 |
 |

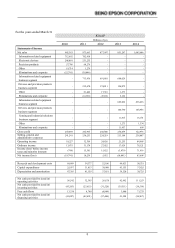
4
IFRS
Millions of yen
Thousands of
U.S. dollars
2014
2015
2015
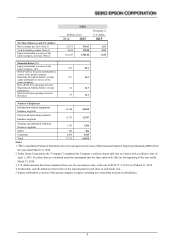
Per Share Data (yen and U.S. dollars)
Basic earnings per share (Note 2)
235.35
314.61
2.62
Cash dividends per share (Note 4)
50.00
115.00
0.95
Equity attributable to owners of the
parent company, per share (Note2)
1,012.83 1,381.66 11.50
Financial Ratios (%)
Equity attributable to owners of the
parent company, ratio
39.9 49.1
ROE (Profit for the period attributable to
owners of the parent company/
Beginning and ending balance average
equity attributable to owners of the
parent company)
27.7 26.3
ROA (Profit from operating activities/
Beginning and ending balance average
total assets)
9.2 13.7
ROS (Profit from operating activities/
Revenue)
7.9 12.1
Number of Employees
Information-related equipment
business segment
55,104 52,010
Devices and precision products
business segment 13,723 12,787
Sensing and industrial solutions
business segment
1,197 1,246
Other
252
306
Corporate
2,895
3,529
Total
73,171
69,878
Notes
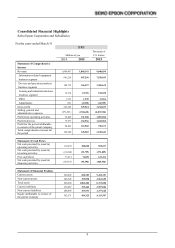
1. The Consolidated Financial Statements have been prepared on the basis of International Financial Reporting Standards (IFRS) from
the year ended March 31, 2014.
2. Seiko Epson Corporation (the “Company”) completed the Company’s ordinary shares split into two shares with an effective date of
April 1, 2015. Per share data are calculated under the assumption that the share splits took effect at the beginning of the year ended
March 31, 2014.
3. U.S. dollar amounts have been translated from yen, for convenience only, at the rate of ¥120.17 =U.S.$1 as of March 31, 2015.
4. In this table, cash dividends per share refers to the amount paid for each share in each fiscal year.
5. Equity attributable to owners of the parent company is equity excluding non-controlling interests in subsidiaries.