Epson 2012 Annual Report Download - page 86
Download and view the complete annual report
Please find page 86 of the 2012 Epson annual report below. You can navigate through the pages in the report by either clicking on the pages listed below, or by using the keyword search tool below to find specific information within the annual report.-
 1
1 -
2
-
3
-
4
-
5
-
6
-
7
-
8
-
9
-
10
-
11
-
12
-
13
-
14
-
15
-
16
-
17
-
18
-
19
-
20
-
21
-
22
-
23
-
24
-
25
-
26
-
27
-
28
-
29
-
30
-
31
-
32
-
33
-
34
-
35
-
36
-
37
-
38
-
39
-
40
-
41
-
42
-
43
-
44
-
45
-
46
-
47
-
48
-
49
-
50
-
51
-
52
-
53
-
54
-
55
-
56
-
57
-
58
-
59
-
60
-
61
-
62
-
63
-
64
-
65
-
66
-
67
-
68
-
69
-
70
-
71
-
72
-
73
-
74
-
75
-
 76
76 -
 77
77 -
 78
78 -
 79
79 -
 80
80 -
 81
81 -
 82
82 -
 83
83 -
 84
84 -
 85
85 -
 86
86 -
 87
87 -
 88
88 -
 89
89 -
 90
90 -
 91
91 -
 92
92 -
 93
93 -
 94
94 -
 95
95 -
 96
96 -
97
-
98
-
99
-
100
 |
 |

85
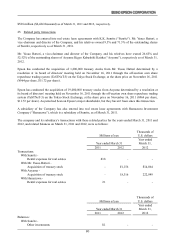
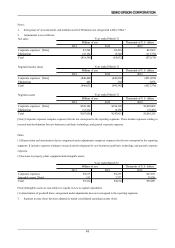
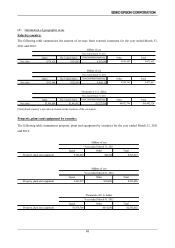
(d) Information of geographic areas
Sales by country:
The following table summarizes the amount of revenue from external customers for the year ended March 31,
2011 and 2012:
[Note] Each country’s net sales are based on the location of the customers.
Property, plant and equipment by country:
The following table summarizes property, plant and equipment by countries for the year ended March 31, 2011
and 2012:
$1,978,306 $614,296
Other
Thousands of U.S. dollars
Year ended March 31, 2012
Property, plant and equipment $2,592,602
Japan Total
¥162,597 ¥50,488 ¥213,086
Year ended March 31, 2012
Millions of yen
Japan
Property, plant and equipment
TotalOther
¥165,402 ¥48,220 ¥213,623Property, plant and equipment
Millions of yen
Year ended March 31, 2011
Japan Other Total
$3,819,686 $1,462,452 $1,327,594 $4,072,796
Year ended March 31, 2012
Thousands of U.S. dollars
$10,682,528
TotalJapan The United States
Chinaincluding Hong Kong
Other
Net sales
¥313,940 ¥120,199 ¥109,115 ¥334,741 ¥877,997
Total
Net sales
Japan The United States
Chinaincluding Hong Kong
Other
Year ended March 31, 2012
Millions of yen
¥370,124 ¥134,203 ¥107,848 ¥361,487 ¥973,663
Millions of yen
Year ended March 31, 2011
Japan The United States
Chinaincluding Hong Kong
Other Total
Net sales