Epson 2012 Annual Report Download - page 85
Download and view the complete annual report
Please find page 85 of the 2012 Epson annual report below. You can navigate through the pages in the report by either clicking on the pages listed below, or by using the keyword search tool below to find specific information within the annual report.-
 1
1 -
2
-
3
-
4
-
5
-
6
-
7
-
8
-
9
-
10
-
11
-
12
-
13
-
14
-
15
-
16
-
17
-
18
-
19
-
20
-
21
-
22
-
23
-
24
-
25
-
26
-
27
-
28
-
29
-
30
-
31
-
32
-
33
-
34
-
35
-
36
-
37
-
38
-
39
-
40
-
41
-
42
-
43
-
44
-
45
-
46
-
47
-
48
-
49
-
50
-
51
-
52
-
53
-
54
-
55
-
56
-
57
-
58
-
59
-
60
-
61
-
62
-
63
-
64
-
65
-
66
-
67
-
68
-
69
-
70
-
71
-
72
-
73
-
74
-
 75
75 -
 76
76 -
 77
77 -
 78
78 -
 79
79 -
 80
80 -
 81
81 -
 82
82 -
 83
83 -
 84
84 -
 85
85 -
 86
86 -
 87
87 -
 88
88 -
 89
89 -
 90
90 -
 91
91 -
 92
92 -
 93
93 -
 94
94 -
 95
95 -
96
-
97
-
98
-
99
-
100
 |
 |

84
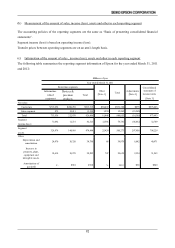
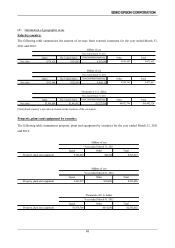
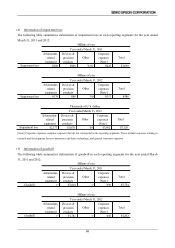
Notes;
1. Intra-group services and small- and medium-sized LCD business are categorized within “Other.”
2. Adjustments were as follows.
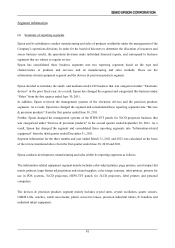
[Note] Corporate expenses comprise expenses that do not correspond to the reporting segments. These include expenses relating to
research and development for new businesses and basic technology, and general corporate expenses.
Other
(1) Depreciation and amortization that is categorized under adjustments comprises expenses that do not correspond to the reporting
segments. It includes expenses relating to research and development for new businesses and basic technology, and general corporate
expenses.
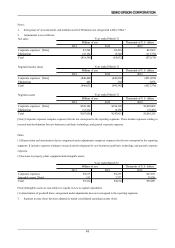
(2) Increase in property, plant, equipment and intangible assets;
[Note] Intangible assets are non-subject to regular review as capital expenditure.
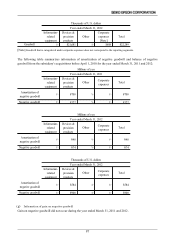
(3) Amortization of goodwill that is categorized under adjustments does not correspond to the reporting segments.
3. Segment income (loss) has been adjusted to match consolidated operating income (loss).
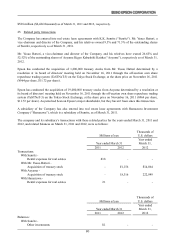
Segment assets
Corporate expenses [Note] ¥310,168 ¥254,198 $3,092,809
Eliminations (12,212) (6,286) (76,481)
Total ¥297,956 ¥247,911 $3,016,328
Year ended March 31
Millions of yen Thousands of U.S. dollars
2011 2012 2012
Net sales
Corporate expenses [Note] ¥3,764 ¥3,416 $41,562
Eliminations (18,154) (9,348) (113,736)
Total (¥14,390) (¥5,932) ($72,174)
Millions of yen Thousands of U.S. dollars
2011 2012
Year ended March 31
2012
Segment income (loss)
Corporate expenses [Note] (¥46,440) (¥43,650) ($531,074)
Eliminations 408 304 3,698
Total (¥46,032) (¥43,345) ($527,376)
Year ended March 31
Millions of yen Thousands of U.S. dollars
20122011 2012
Corporate expenses ¥2,173 ¥2,233 $27,169
Intangible assets [Note] 151 2,377 28,920
Total ¥2,324 ¥4,610 $56,089
20122011 2012
Year ended March 31
Millions of yen Thousands of U.S. dollars