Epson 2012 Annual Report Download - page 83
Download and view the complete annual report
Please find page 83 of the 2012 Epson annual report below. You can navigate through the pages in the report by either clicking on the pages listed below, or by using the keyword search tool below to find specific information within the annual report.-
 1
1 -
2
-
3
-
4
-
5
-
6
-
7
-
8
-
9
-
10
-
11
-
12
-
13
-
14
-
15
-
16
-
17
-
18
-
19
-
20
-
21
-
22
-
23
-
24
-
25
-
26
-
27
-
28
-
29
-
30
-
31
-
32
-
33
-
34
-
35
-
36
-
37
-
38
-
39
-
40
-
41
-
42
-
43
-
44
-
45
-
46
-
47
-
48
-
49
-
50
-
51
-
52
-
53
-
54
-
55
-
56
-
57
-
58
-
59
-
60
-
61
-
62
-
63
-
64
-
65
-
66
-
67
-
68
-
69
-
70
-
71
-
72
-
 73
73 -
 74
74 -
 75
75 -
 76
76 -
 77
77 -
 78
78 -
 79
79 -
 80
80 -
 81
81 -
 82
82 -
 83
83 -
 84
84 -
 85
85 -
 86
86 -
 87
87 -
 88
88 -
 89
89 -
 90
90 -
 91
91 -
 92
92 -
 93
93 -
94
-
95
-
96
-
97
-
98
-
99
-
100
 |
 |

82
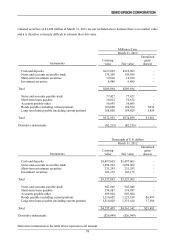
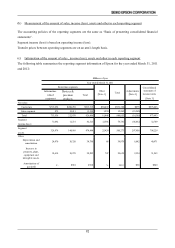
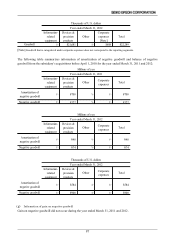
(b) Measurement of the amount of sales, income (loss), assets and other in each reporting segment
The accounting policies of the reporting segments are the same as “Basis of presenting consolidated financial
statements”.
Segment income (loss) is based on operating income (loss).
Transfer prices between operating segments are on an arm’s length basis.
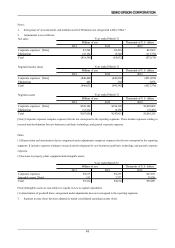
(c) Information of the amount of sales , income (loss), assets and other in each reporting segment
The following table summarizes the reporting segment information of Epson for the year ended March 31, 2011
and 2012:
Information-
related
equipment [Note 3]
Net sales:
Cus to mers ¥ 713,056 ¥ 200,259 ¥ 913,315 ¥ 59,472 ¥972,788 ¥875 ¥973,663
Inter-s egment 879 12,411 13,290 1,974 15,265 (15,265) -
Total 713,936 212,670 926,606 61,446 988,053 (14,390) 973,663
Segment
income (los s )
Segment
assets
Other
Depreciation and
amortization 24,470 10,320 34,790 88 34,879 6,092 40,971
Increase in
property, plant,
equipment and
intangible as sets
18,614 10,278 28,892 747 29,639 2,324 31,963
Amortization of
goodwill \- ¥910 ¥910 \- \9 ¥38 ¥949
Year ended March 31, 2011
Reporting segments
Other
[Note 1] Total
Consolidated
statement of
income totals
Devices &
precision
products
Adjustments
[Note 2]
Total
71,092 11,231 82,323 (3,581) 78,741 (46,032)
25,424 500,273 297,956
Millions of yen
32,709
329,879 144,969 474,848 798,229