Epson 2012 Annual Report Download - page 84
Download and view the complete annual report
Please find page 84 of the 2012 Epson annual report below. You can navigate through the pages in the report by either clicking on the pages listed below, or by using the keyword search tool below to find specific information within the annual report.-
 1
1 -
2
-
3
-
4
-
5
-
6
-
7
-
8
-
9
-
10
-
11
-
12
-
13
-
14
-
15
-
16
-
17
-
18
-
19
-
20
-
21
-
22
-
23
-
24
-
25
-
26
-
27
-
28
-
29
-
30
-
31
-
32
-
33
-
34
-
35
-
36
-
37
-
38
-
39
-
40
-
41
-
42
-
43
-
44
-
45
-
46
-
47
-
48
-
49
-
50
-
51
-
52
-
53
-
54
-
55
-
56
-
57
-
58
-
59
-
60
-
61
-
62
-
63
-
64
-
65
-
66
-
67
-
68
-
69
-
70
-
71
-
72
-
73
-
 74
74 -
 75
75 -
 76
76 -
 77
77 -
 78
78 -
 79
79 -
 80
80 -
 81
81 -
 82
82 -
 83
83 -
 84
84 -
 85
85 -
 86
86 -
 87
87 -
 88
88 -
 89
89 -
 90
90 -
 91
91 -
 92
92 -
 93
93 -
 94
94 -
95
-
96
-
97
-
98
-
99
-
100
 |
 |

83
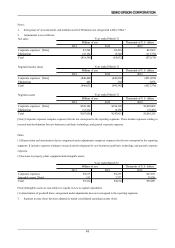
Information-
related
equipment [Note 3]
Net sales:
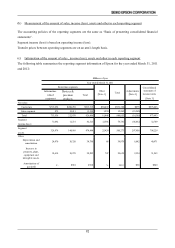
Cus tomers $8,410,196 $2,029,736 $10,439,932 $201,764 $10,641,696 $40,832 $10,682,528
Inter-s egment 6,898 97,177 104,075 8,931 113,006 (113,006) -
Total 8,417,094 2,126,913 10,544,007 210,695 10,754,702 (72,174) 10,682,528
Segment
income (loss)
Segment
assets
Other
Depreciation and
amortization 276,275 123,798 400,073 2,713 402,786 54,045 456,831
Increas e in
property, plant,
equipment and
intangible as s ets
359,047 83,379 442,426 3,796 446,222 56,089 502,311
Amortization of
goodwill $- $10,743 $10,743 $- $10,743 $474 $11,217
3,016,32853,838 5,996,556
789,488 56,320
9,012,8844,320,161 1,622,557 5,942,718
826,998 299,622
Consolidated
statement of
income totals
(527,376)
Adjustments
[Note 2]
Reporting segments
Other
[Note 1]
Year ended March 31, 2012
845,808
Total
Devices &
precision
products
Thousands of U.S. dollars
(18,810)
Total
Information-
related
equipment [Note 3]
Net sales:
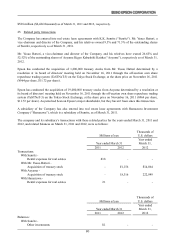
Cus tomers ¥691,234 ¥166,823 ¥858,058 ¥16,582 ¥874,640 ¥3,356 ¥877,997
Inter-s egment 567 7,987 8,554 734 9,288 (9,288) -
Total 691,801 174,811 866,612 17,316 883,929 (5,932) 877,997
Segment
income (loss)
Segment
assets
Other
Depreciation and
amortization 22,706 10,175 32,882 223 33,105 4,441 37,547
Increas e in
property, plant,
equipment and
intangible as s ets
29,510 6,853 36,363 312 36,675 4,610 41,285
Amortization of
goodwill \- ¥883 ¥883 \- ¥883 ¥38 ¥922
Reporting segments
Total
Total
Devices &
precision
products
Other
[Note 1]
64,888 4,629 69,517 24,626(43,345)
355,074 133,358 488,432 4,424 492,857 247,911
Millions of yen
Year ended March 31, 2012
740,769
Consolidated
statement of
income totals
Adjustments
[Note 2]
(1,545) 67,971