Eli Lilly 2012 Annual Report Download - page 3
Download and view the complete annual report
Please find page 3 of the 2012 Eli Lilly annual report below. You can navigate through the pages in the report by either clicking on the pages listed below, or by using the keyword search tool below to find specific information within the annual report.-
 1
1 -
 2
2 -
 3
3 -
 4
4 -
 5
5 -
 6
6 -
 7
7 -
 8
8 -
 9
9 -
 10
10 -
 11
11 -
 12
12 -
 13
13 -
 14
14 -
15
-
16
-
17
-
18
-
19
-
20
-
21
-
22
-
23
-
24
-
25
-
26
-
27
-
28
-
29
-
30
-
31
-
32
-
33
-
34
-
35
-
36
-
37
-
38
-
39
-
40
-
41
-
42
-
43
-
44
-
45
-
46
-
47
-
48
-
49
-
50
-
51
-
52
-
53
-
54
-
55
-
56
-
57
-
58
-
59
-
60
-
61
-
62
-
63
-
64
-
65
-
66
-
67
-
68
-
69
-
70
-
71
-
72
-
73
-
74
-
75
-
76
-
77
-
78
-
79
-
80
-
81
-
82
-
83
-
84
-
85
-
86
-
87
-
88
-
89
-
90
-
91
-
92
-
93
-
94
-
95
-
96
-
97
-
98
-
99
-
100
-
101
-
102
-
103
-
104
-
105
-
106
-
107
-
108
-
109
-
110
-
111
-
112
-
113
-
114
-
115
-
116
-
117
-
118
-
119
-
120
-
121
-
122
-
123
-
124
-
125
-
126
-
127
-
128
-
129
-
130
-
131
-
132
-
133
-
134
-
135
-
136
-
137
-
138
-
139
-
140
-
141
-
142
-
143
-
144
-
145
-
146
-
147
-
148
-
149
-
150
-
151
-
152
-
153
-
154
-
155
-
156
-
157
-
158
-
159
-
160
-
161
-
162
-
163
-
164
 |
 |

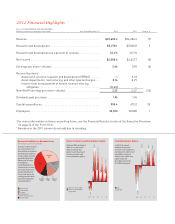
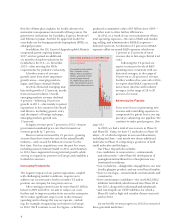
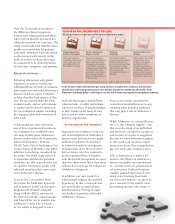
Revenue Growth Across Business Areas
($ millions, percent growth)
Revenue in Neuroscience
decreased 22 percent
due to the loss of patent
protection for Zyprexa
in most major markets,
partially offset by a
20 percent increase
in Cymbalta.
Excluding Zyprexa,
Neuroscience revenue
increased 15 percent.
Animal Health grew
21 percent driven by
strong growth in both
food and companion
animal products.
Neuroscience
Endocrinology
Oncology
Cardiovascular
Other Pharmaceutical
Animal Health
$266.8
-1%
$6,810.9
0%
$2,632.5
+6%
$7,575.1
-22% $3,281.6
-1%
$2,036.5
+21%
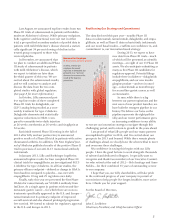
13.4%
31.4%
12.3%
27.8%
-7.5%
-16.3%
Return on Assets and Shareholders’ Equity
08 09 10 11 12
15.8%
51.0%
ROA and ROE declined in
2012 as a result of the
Zyprexa patent loss,
offset in part by growth
in other products and
cost-containment efforts.
Return on Assets (ROA)
Return on Shareholders’
Equity (ROE)
17.7%
46.1%
24.9%
2.1%
24.0%
16.3%
-21.4%
-36.9%
Total Shareholder Return
08 09 10 11 12
-6.1% 26.4%
In 2012, the steady
dividend stream and
increase in the stock price
contributed to Lilly’s total
shareholder return of
24.0 percent, which once
again compared
favorably against the
S&P 500 benchmark.
Lilly
S&P 500
3.7%
15.0%
2012 Financial Highlights
ELI LILLY AND COMPANY AND SUBSIDIARIES
(Dollars in millions, except per-share data) Year Ended December 31 2012 2011 Change %
Revenue.................................................... $22,603.4 $24,286.5 (7)
Research and development ................................... $5,278.1 $5,020.8 5
Research and development as a percent of revenue............... 23.4% 20.7%
Net income ................................................. $4,088.6 $4,347.7 (6)
Earnings per share—diluted................................... 3.66 3.90 (6)
Reconciling items1:
Acquired in-process research and development (IPR&D) ...... — 0.23
Asset impairments, restructuring, and other special charg
es ... 0.16 0.29
Income from early payment of Amylin revenue-sharing
obligation ........................................... (0.43) —
Non-GAAP earnings per share—diluted......................... 3.39 4.412 (23)
Dividends paid per share...................................... 1.96 1.96
Capital expenditures ......................................... 905.4 672.0 35
Employees ................................................. 38,350 38,080 1
1 For more information on these reconciling items, see the Financial Results section of the Executive Overview
on page 24 of the Form 10-K.
2 Numbers in the 2011 column do not add due to rounding.