Eli Lilly 2007 Annual Report Download - page 3
Download and view the complete annual report
Please find page 3 of the 2007 Eli Lilly annual report below. You can navigate through the pages in the report by either clicking on the pages listed below, or by using the keyword search tool below to find specific information within the annual report.-
 1
1 -
 2
2 -
 3
3 -
 4
4 -
 5
5 -
 6
6 -
 7
7 -
 8
8 -
 9
9 -
 10
10 -
 11
11 -
 12
12 -
 13
13 -
 14
14 -
15
-
16
-
17
-
18
-
19
-
20
-
21
-
22
-
23
-
24
-
25
-
26
-
27
-
28
-
29
-
30
-
31
-
32
-
33
-
34
-
35
-
36
-
37
-
38
-
39
-
40
-
41
-
42
-
43
-
44
-
45
-
46
-
47
-
48
-
49
-
50
-
51
-
52
-
53
-
54
-
55
-
56
-
57
-
58
-
59
-
60
-
61
-
62
-
63
-
64
-
65
-
66
-
67
-
68
-
69
-
70
-
71
-
72
-
73
-
74
-
75
-
76
-
77
-
78
-
79
-
80
-
81
-
82
-
83
-
84
-
85
-
86
-
87
-
88
-
89
-
90
-
91
-
92
-
93
-
94
-
95
-
96
-
97
-
98
-
99
-
100
-
101
-
102
-
103
-
104
-
105
-
106
-
107
-
108
-
109
-
110
-
111
-
112
-
113
-
114
-
115
-
116
-
117
-
118
-
119
-
120
-
121
-
122
-
123
-
124
-
125
-
126
-
127
-
128
-
129
-
130
-
131
-
132
 |
 |

1
EgdYjXihAVjcX]ZYI]^h9ZXVYZ=VkZ9g^kZc
DjgHVaZh<gdli]
b^aa^dch
Jg^ÊgÍÊÄ:gÄÊsÊÒÀʨÀ^ÒSÍÄÊ:ÒSg^ÊÍÄÊ
^gS:^gnÛJ:Í:[Ê-ÍÀ:ÍÍgÀ:[ÊÍ:[ÊÀÍg[Ê6zÀÄ[Ê
:Ä[Ê-ÛJÛ:Ú[ÊÛgÍÍ:[Ê:^Ê7gÍÀgØgnSÀg:Äg^Ê
JÛÊuÇʨgÀSgÍÊØgÀÊÑßßÈ[ÊÀg¨ÀgÄgÍzÊdÈ®ßÊJ[Ê
ÀÊÎÑʨgÀSgÍÊsÊÍÍ:ÊgÍÊÄ:gÄ[ÊS¨:Àg^ÊÙÍÊ
dήlÊJ[ÊÀÊÑxʨgÀSgÍÊÊÑßßÈ®ÊÄÄÒzÊÒÀÊ
:SµÒÄÍÊsÊ!-ÊSSÒÀÀg^ÊÊ:Ò:ÀÛÊ£[ÊÑßßÈ[Ê
ÍgÊSJg^ÊgÍÊÄ:gÄÊsÊÍgÄgʨÀ^ÒSÍÄÊSÀg:Äg^Ê
JÛÊÎÎʨgÀSgÍÊØgÀÊÑßßÈ®ÊJg^ÊgÍÊÄ:gÄÊsÊ
gÞ:À[ÊÒ:z[ÊØÄÍ:[Ê:^ÊSÍÄÊSÀg:Äg^Ê
lʨgÀSgÍÊÍÊdx®uÊJÊ:^ÊÀg¨ÀgÄgÍg^ÊÑxʨgÀSgÍÊ
sÊÄ:gÄ®Ê9Û¨ÀgÚ:ÊÄ:gÄÊSÀg:Äg^ÊʨgÀSgÍÊÊÑßßÇ®Ê
%
*!%%%
&%!%%%
&*!%%%
'%!%%%
%( %) %* %+ %,
EgdYjXihAVjcX]ZYI]^h9ZXVYZ
ÊÊÛJ:Í:[Ê-ÍÀ:ÍÍgÀ:[ÊÍ:[ÊÀÍg[Ê6zÀÄ[Ê:Ä[Ê-ÛJÛ:Ú[ÊÛgÍÍ:[Ê:^Ê7gÍÀgØgÊ
Di]Zg:hiVWa^h]ZYEgdYjXih
Ê
gÞ:À[ÊÒ:z[ÊØÄÍ:[Ê:^ÊSÍÄ
OnegZmV
Di]Zg
GZijgcdc6hhZihVcYH]VgZ]daYZghÉ:fj^in
GD6WVhZYdccZi^cXdbZY^k^YZYWn
fjVgiZganVkZgV\ZVhhZiWVaVcXZ0
GD:WVhZYdccZi^cXdbZY^k^YZYWn
VkZgV\Zh]VgZ]daYZghÉZfj^in
gÍÊSgÊSÀg:Äg^Ê££Ê¨gÀSgÍÊÊÑßßÇÊ:ÄÊ
S¨:Àg^ÊÍÊÑßßÈ®ÊgÍÊSg[Ê,![Ê:^Ê,!Ê
ÙgÀgʨ:SÍg^ÊJÛÊÄÍÀ:ÍgzSÊ^gSÄÄÊÍÊJÍ:Ê
ÍgÊÀzÍÄÊÍÊÄgØgÀ:ÊgSÒgÄÊ:^ÊÍgSzgÄÊ
ÊØ:ÀÒÄÊSS:ÊÄÍ:zgÄÊsÊ^gØg¨gÍÊ:ÄÊ
^gÄSÀJg^ÊÊsÍÍgÊÎ[Ê:ÄÊÙgÊ:ÄÊ:ÄÄgÍÊ
¨:ÀgÍÄ[ÊÀgÄÍÀÒSÍÒÀz[Ê:^ÊÍgÀÊÀg:Íg^Ê
ÍgÄ®Ê.gÄgÊÄÍÀ:ÍgzSÊ^gSÄÄÊÀgÄÒÍg^ÊÊ
S:ÀzgÄÊsÊd£®ßuÊJÊÍ:ÍÊÍg^ÊÍgÊzÀÙÍÊ
sÊ,!ÊÍÊ£®ßʨgÀSgÍ:zgʨÍ[ÊÍÊ:ÊÀgÍÒÀÊsÊ
£Ñ®ÑʨgÀSgÍ[Ê:^ÊS:ÒÄg^Ê:Ê^gÄÍÊ^gSgÊÊ
,!ÊsÊß®uʨgÀSgÍ:zgʨÍÄ[ÊÍÊ:ÊÀgÍÒÀÊsÊ
Ñx®ßʨgÀSgÍ®Ê
%( %) %* %+ %,
&'#+
'-#)
,#-
&,#*
-#'
&-#'
&&#'
')#*
&'#'
')#%
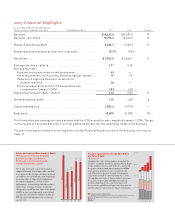
2007 Financial Highlights
ELI LILLY AND COMPANY AND SUBSIDIARIES
(Dollars in millions, except per-share data) Year Ended December 31 2007 2006 Change %
Net sales . . . . . . . . . . . . . . . . . . . . . . . . . . . . . . . . . . . . . . . . . . . . . . . . . . $18,633.5 $15,691.0 19
Net sales—pro forma1 . . . . . . . . . . . . . . . . . . . . . . . . . . . . . . . . . . . . . . 18,706.2 16,446.2 14
Research and development . . . . . . . . . . . . . . . . . . . . . . . . . . . . . . . . . . 3,486.7 3,129.3 11
Research and development as a percent of net sales . . . . . . . . . . . . . 18.7% 19.9%
Net income . . . . . . . . . . . . . . . . . . . . . . . . . . . . . . . . . . . . . . . . . . . . . . . . $ 2,953.0 $ 2,662.7 11
Earnings per share—diluted. . . . . . . . . . . . . . . . . . . . . . . . . . . . . . . . . . 2.71 2.45
Reconciling items2:
Acquired in-process research and development . . . . . . . . . . . . . . .63 —
Asset impairments, restructuring, and other special charges . . . .15 .73
Reduction in expected insurance recoveries for
product liabilities . . . . . . . . . . . . . . . . . . . . . . . . . . . . . . . . . . . . . . .06 —
Pro forma adjustment as if the ICOS acquisition was
completed on January 1, 20061 . . . . . . . . . . . . . . . . . . . . . . . . . . (.01) (.15)
Adjusted earnings per share—diluted. . . . . . . . . . . . . . . . . . . . . . . . . . 3.54 3.03 17
Dividends paid per share. . . . . . . . . . . . . . . . . . . . . . . . . . . . . . . . . . . . . 1.70 1.60 6
Capital expenditures . . . . . . . . . . . . . . . . . . . . . . . . . . . . . . . . . . . . . . . . 1,082.4 1,077.8 —
Employees . . . . . . . . . . . . . . . . . . . . . . . . . . . . . . . . . . . . . . . . . . . . . . . . 40,600 41,500 (2)
1Pro forma sales and earnings per share assume that the ICOS acquisition was completed January 1, 2006. The pro
forma results are presented in order to provide additional insights into the underlying trends in the business.
2For more information on these reconciling items, see the Financial Results section of the Executive Overview on
page 10.