Electrolux 2000 Annual Report Download - page 8
Download and view the complete annual report
Please find page 8 of the 2000 Electrolux annual report below. You can navigate through the pages in the report by either clicking on the pages listed below, or by using the keyword search tool below to find specific information within the annual report.
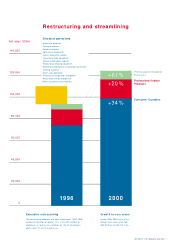
Value drivers
Components Activities
Sales growth Organic growth Customer care
Customer mix Product management, R&D
Acquisitions New brand policy
Marketing
Territory management
Cost reductions SG&A costs
Improved product mix New pan-European structure
Demand flow/supply chain
New products/
product platforms
Asset efficiency Group structure Divestments
Asset turnover Rationalization
Asset mix Make or buy
Reduce working capital
Higher operating
margin/lower cost
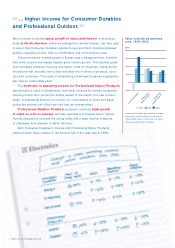
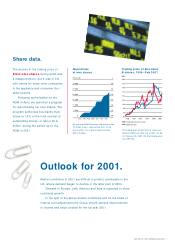
6REPORT BY THE PRESIDENT AND CEO
We have used a model for value creation internally since 1998 and are
measuring performance by sector, product line and region.
The goal is to achieve average annual growth in value
created of at least SEK 1 billion for the period 2000–2002.
The best way to create value is to increase sales without increasing
the assets employed in operations. That is why we focus on growth.
But we also have to drive down costs, improve the rate of capital
turnover, and rationalize assets that don’t generate sufficient returns.
The improvement in value creation that we want to achieve up to
year-end 2002 has to be driven mainly by greater internal efficiency,
which will generate higher margin.
EBIT = Earnings before interest and taxes,
excluding items affecting comparability.
WACC = Weighted Average Cost of Capital.
The WACC for 2000 and 2001 is 14%.
In 1997–2000 the Group achieved average annual
growth in value created of slightly more than SEK 1
billion.
We have reversed the trend
Value creation
Value creation is our measure of
performance within the Group.
–2,000
–1,000
0
1,000
2,000
3,000
4,000
5,000
200019991998199719961995 20022001
SEKm

