EMC 2002 Annual Report Download - page 17
Download and view the complete annual report
Please find page 17 of the 2002 EMC annual report below. You can navigate through the pages in the report by either clicking on the pages listed below, or by using the keyword search tool below to find specific information within the annual report.
Table of Contents
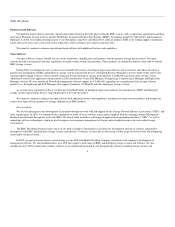
ITEM 6. SELECTED CONSOLIDATED FINANCIAL DATA
FIVE YEAR SELECTED CONSOLIDATED FINANCIAL DATA(1)
EMC Corporation
(in thousands, except per share amounts)
Year Ended December 31,
2002 2001 2000 1999 1998
Summary of Operations:
Revenues $5,438,352 $7,090,633 $ 8,872,816 $6,715,610 $5,436,158
Operating income (loss) (2) (493,831) (697,841) 2,256,903 1,241,094 834,267
Net income (loss) (2) (118,706) (507,712) 1,782,075 1,010,570 653,978
Net income (loss) per weighted
average share, basic (2)(3) $ (.05) $ (0.23) $ 0.82 $ 0.49 $ 0.32
Net income (loss) per weighted
average share, diluted (2)(3) $ (.05) $ (0.23) $ 0.79 $ 0.46 $ 0.30
Weighted average shares, basic (3) 2,206,294 2,211,273 2,164,180 2,061,101 2,030,742
Weighted average shares, diluted (3) 2,206,294 2,211,273 2,245,203 2,219,065 2,188,430
Balance Sheet Data:
Working capital $2,175,598 $2,743,828 $ 3,986,404 $2,922,481 $2,825,000
Total assets 9,590,447 9,889,635 10,537,799 7,064,701 5,600,459
Long-term obligations (4) 6,963 17,202 14,457 686,609 751,646
Stockholders' equity $7,226,002 $7,600,820 $ 8,177,209 $4,951,786 $3,728,990
(1) The selected consolidated financial data for all periods presented include the effects of the acquisition of Data General on October 12, 1999, which was
accounted for as a pooling-of-interests.
(2) In 2002, we incurred net restructuring costs and other special items totaling approximately $100,000 pre-tax ($82,000 after-tax). The pre-tax amounts
consist of $91,000 included in operating loss and $9,000 included in other expense, net. In 2001, we incurred restructuring costs and other special
charges totaling approximately $825,000 pre-tax ($675,000 after-tax). The pre-tax amounts consist of $719,000 included in operating loss and $106,000
included in other expense, net. In 1999, we incurred restructuring, merger and other special charges totaling approximately $224,000 pre-tax ($170,000
after-tax). All pre-tax amounts were included in operating income. In 1998, we incurred restructuring, merger and other special charges totaling
approximately $135,000 (pre and after-tax), all of which were included in operating income. See Note C to our Consolidated Financial Statements.
(3) All share and per share amounts have been restated to reflect the stock splits effective May 28, 1999 and June 2, 2000 for all periods presented.
(4) Includes long-term debt and capital leases, excluding current portion.
14


