E-Z-GO 2014 Annual Report Download - page 6
Download and view the complete annual report
Please find page 6 of the 2014 E-Z-GO annual report below. You can navigate through the pages in the report by either clicking on the pages listed below, or by using the keyword search tool below to find specific information within the annual report.-
 1
1 -
 2
2 -
 3
3 -
 4
4 -
 5
5 -
 6
6 -
 7
7 -
 8
8 -
 9
9 -
 10
10 -
 11
11 -
 12
12 -
 13
13 -
 14
14 -
 15
15 -
 16
16 -
 17
17 -
18
-
19
-
20
-
21
-
22
-
23
-
24
-
25
-
26
-
27
-
28
-
29
-
30
-
31
-
32
-
33
-
34
-
35
-
36
-
37
-
38
-
39
-
40
-
41
-
42
-
43
-
44
-
45
-
46
-
47
-
48
-
49
-
50
-
51
-
52
-
53
-
54
-
55
-
56
-
57
-
58
-
59
-
60
-
61
-
62
-
63
-
64
-
65
-
66
-
67
-
68
-
69
-
70
-
71
-
72
-
73
-
74
-
75
-
76
-
77
-
78
-
79
-
80
-
81
-
82
-
83
-
84
-
85
-
86
-
87
-
88
-
89
-
90
-
91
-
92
-
93
-
94
 |
 |

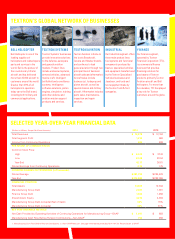
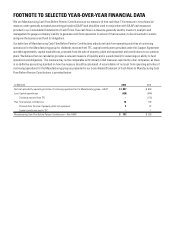
FOOTNOTE TO SELECTED YEAR-OVER-YEAR FINANCIAL DATA
1
We use Manufacturing Cash Flow Before Pension Contributions as our measure of free cash ow. This measure is not a nancial
measure under generally accepted accounting principles (GAAP) and should be used in conjunction with GAAP cash measures
provided in our Consolidated Statements of Cash Flows. Free cash ow is a measure generally used by investors, analysts and
management to gauge a company’s ability to generate cash from operations in excess of that necessary to be reinvested to sustain
and grow the business and fund its obligations.
Our denition of Manufacturing Cash Flow Before Pension Contributions adjusts net cash from operating activities of continuing
operations for the Manufacturing group for dividends received from TFC, capital contributions provided under the Support Agreement
and debt agreements, capital expenditures, proceeds from the sale of property, plant and equipment and contributions to our pension
plans. We believe that our calculation provides a relevant measure of liquidity and is a useful basis for assessing our ability to fund
operations and obligations. This measure may not be comparable with similarly titled measures reported by other companies, as there
is no denitive accounting standard on how the measure should be calculated. A reconciliation of net cash from operating activities of
continuing operations for the Manufacturing group as presented in our Consolidated Statement of Cash Flows to Manufacturing Cash
Flow Before Pension Contributions is provided below:
(In Millions) 2014 2013
Net cash provided by operating activities of continuing operations for the Manufacturing group—GAAP $ 1,097 $ 658
Less: Capital expenditures (429) (444)
Dividends received from TFC –(175)
Plus: Total pension contributions 76 194
Proceeds from the sale of property, plant and equipment 922
Capital contribution paid to TFC –1
Manufacturing Cash Flow Before Pension Contributions—Non-GAAP $ 753 $ 256