E-Z-GO 2013 Annual Report Download - page 10
Download and view the complete annual report
Please find page 10 of the 2013 E-Z-GO annual report below. You can navigate through the pages in the report by either clicking on the pages listed below, or by using the keyword search tool below to find specific information within the annual report.-
 1
1 -
 2
2 -
 3
3 -
 4
4 -
 5
5 -
 6
6 -
 7
7 -
 8
8 -
 9
9 -
 10
10 -
 11
11 -
 12
12 -
 13
13 -
 14
14 -
 15
15 -
 16
16 -
 17
17 -
 18
18 -
 19
19 -
 20
20 -
 21
21 -
22
-
23
-
24
-
25
-
26
-
27
-
28
-
29
-
30
-
31
-
32
-
33
-
34
-
35
-
36
-
37
-
38
-
39
-
40
-
41
-
42
-
43
-
44
-
45
-
46
-
47
-
48
-
49
-
50
-
51
-
52
-
53
-
54
-
55
-
56
-
57
-
58
-
59
-
60
-
61
-
62
-
63
-
64
-
65
-
66
-
67
-
68
-
69
-
70
-
71
-
72
-
73
-
74
-
75
-
76
-
77
-
78
-
79
-
80
-
81
-
82
-
83
-
84
-
85
-
86
-
87
-
88
-
89
-
90
-
91
-
92
-
93
-
94
-
95
-
96
-
97
-
98
-
99
-
100
-
101
-
102
 |
 |

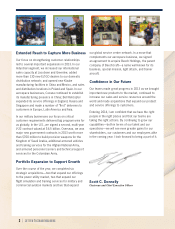
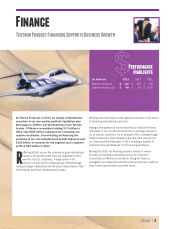
Working with these export credit agencies has been a critical part
of attracting international customers.
Having a strong fi nancial service business to facilitate the loans
and leases of our aircraft and rotorcraft is a winning proposition
for us and our customers. As an example of this, funding through
Textron Financial in 2013 supported the sale of 66 new aircraft
for Cessna and Bell Helicopter in 2013, including a number of
important rotocraft deliveries for the oil and gas industry.
Moving into 2014, our fi nancing business intends to remain
focused on providing a seamless process for customers
to purchase and fi nance our products. Doing this helps us
strengthen our relationship with the customer and sets a path for
future sales opportunities around the world.
Textron Product Financing Supports Business Growth
Finance
(In millions) 2013 2012 2011
Segment Revenues $132$215$103
Segment Profi t (Loss) $49 $ 64 $ (333)
Finance | 8
At Textron Financial, in 2013, we largely completed the
execution of our non-captive portfolio liquidation plan
that began in 2008 to exit the fi nancing of non-Textron
brands. Of fi nance receivables totaling $1.5 billion in
2013, only $185 million represent our remaining non-
captive receivables. Concentrating on fi nancing the
purchase of our own manufactured brands helped us post
$132 million in revenues for the segment and a segment
profi t of $49 million in 2013.
Refl ecting efforts across the company to grow international
business, 60 percent of the loans we originated in 2013
were for non-U.S. customers. A large portion—90
percent—of that non-U.S. fi nancing was offered through
our key strategic relationship with the Export-Import Bank of the
United States and Export Development Canada.
Performance
Highlights