E-Z-GO 2009 Annual Report Download - page 8
Download and view the complete annual report
Please find page 8 of the 2009 E-Z-GO annual report below. You can navigate through the pages in the report by either clicking on the pages listed below, or by using the keyword search tool below to find specific information within the annual report.-
 1
1 -
 2
2 -
 3
3 -
 4
4 -
 5
5 -
 6
6 -
 7
7 -
 8
8 -
 9
9 -
 10
10 -
 11
11 -
 12
12 -
 13
13 -
 14
14 -
 15
15 -
 16
16 -
 17
17 -
 18
18 -
 19
19 -
20
-
21
-
22
-
23
-
24
-
25
-
26
-
27
-
28
-
29
-
30
-
31
-
32
-
33
-
34
-
35
-
36
-
37
-
38
-
39
-
40
-
41
-
42
-
43
-
44
-
45
-
46
-
47
-
48
-
49
-
50
-
51
-
52
-
53
-
54
-
55
-
56
-
57
-
58
-
59
-
60
-
61
-
62
-
63
-
64
-
65
-
66
-
67
-
68
-
69
-
70
-
71
-
72
-
73
-
74
-
75
-
76
-
77
-
78
-
79
-
80
-
81
-
82
-
83
-
84
-
85
-
86
-
87
-
88
-
89
-
90
-
91
-
92
-
93
-
94
-
95
-
96
-
97
-
98
-
99
-
100
-
101
-
102
-
103
-
104
-
105
-
106
-
107
-
108
 |
 |

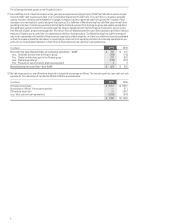
The following footnotes pertain to the President’s Letter:
(1) Free cash flow is not a financial measure under generally accepted accounting principles (GAAP) and should be used in conjunc-
tion with GAAP cash measures provided in our Consolidated Statement of Cash Flows. Free cash flow is a measure generally
used by investors, analysts and management to gauge a company’s ability to generate cash from operations in excess of that
necessary to be reinvested to sustain and grow the business. Our definition of Manufacturing free cash flow uses net cash from
operating activities of continuing operations and subtracts dividends received from the Finance group and capital expenditures,
then adds back capital contributions provided under the Support Agreement with Textron Financial Corporation, plus proceeds
from the sale of plant, property and equipment. We believe that our Manufacturing free cash flow calculation provides a relevant
measure of liquidity and a useful basis for assessing our ability to fund operations. Our Manufacturing free cash flow measure
may not be comparable with similarly titled measures reported by other companies, as there is no definitive accounting standard
on how the measure should be calculated. A reconciliation of net cash from operating activities of continuing operations as pre-
sented in our Consolidated Statement of Cash Flows to Manufacturing free cash flow is provided below:
(In millions) 2009 2008
Net cash from operating activities of continuing operations – GAAP $ 738 $ 407
Less: Dividends received from the Finance group (349) (142)
Plus: Capital contributions paid to the Finance group 270 625
Less: Capital expenditures (238) (537)
Plus: Proceeds on sale of property, plant and equipment 3 9
Manufacturing free cash flow – Non-GAAP $ 424 $ 362
(2) Net debt represents on- and off-balance sheet debt, along with borrowings on officers’ life insurance policies, less cash and cash
equivalents. Our calculation of net debt for 2008 and 2009 is provided below:
(In millions) 2009 2008
On-balance sheet debt $ 9,251 $ 9,957
Borrowings on officers’ life insurance policies — 411
Off-balance sheet debt 31 2,067
Less: Total cash and cash equivalents (1,892) (547)
$ 7,390 $ 11,888
6