E-Z-GO 2007 Annual Report Download - page 5
Download and view the complete annual report
Please find page 5 of the 2007 E-Z-GO annual report below. You can navigate through the pages in the report by either clicking on the pages listed below, or by using the keyword search tool below to find specific information within the annual report.-
 1
1 -
 2
2 -
 3
3 -
 4
4 -
 5
5 -
 6
6 -
 7
7 -
 8
8 -
 9
9 -
 10
10 -
 11
11 -
 12
12 -
 13
13 -
 14
14 -
 15
15 -
 16
16 -
17
-
18
-
19
-
20
-
21
-
22
-
23
-
24
-
25
-
26
-
27
-
28
-
29
-
30
-
31
-
32
-
33
-
34
-
35
-
36
-
37
-
38
-
39
-
40
-
41
-
42
-
43
-
44
-
45
-
46
-
47
-
48
-
49
-
50
-
51
-
52
-
53
-
54
-
55
-
56
-
57
-
58
-
59
-
60
-
61
-
62
-
63
-
64
-
65
-
66
-
67
-
68
-
69
-
70
-
71
-
72
-
73
-
74
-
75
-
76
-
77
-
78
-
79
-
80
-
81
-
82
-
83
-
84
-
85
-
86
-
87
-
88
-
89
-
90
-
91
-
92
-
93
-
94
-
95
-
96
-
97
-
98
-
99
-
100
-
101
-
102
-
103
-
104
-
105
-
106
-
107
-
108
 |
 |
To Our Shareholders, Employees and Customers:
I’m extremely proud of Textron’s powerful performance in 2007, as
evidenced by a range of fi nancial indicators. But what’s most im-
portant to me is the story behind the numbers – how we achieved
them and how this positions us well for a powerful future.
We made great strides in leveraging resources, talent and technol-
ogy across our business units. Textron Six Sigma has given us more
than a common operational language: It has provided us a com-
mon approach to improve every business. At the heart of it all, our
more than 44,000 employees demonstrate each day that company
greatness really does start with people. Knowing this, a key focus
of our business is to increase employee engagement as we advance
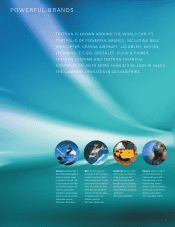
toward our vision of becoming the premier multi-industry company,
recognized for our network of powerful brands, world-class
processes and talented people.
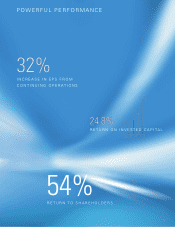
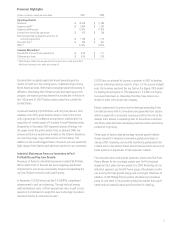
A Broad Range of Financial Indicators Refl ects a Year of
Powerful Performance
Revenues in 2007 increased 15 percent to $13.2 billion. Earnings
per share (EPS) from continuing operations rose 32 percent to $3.59,
with manufacturing margins expanding by 160 basis points. That’s
signifi cant, and for this we can point to the successful implemen-
tation across the enterprise of our Textron Six Sigma business
improvement process. We certifi ed 153 Six Sigma Black Belts and
1,429 Green Belts during the year, bringing our totals to nearly 900
Black Belts and more than 4,200 Green Belts since the inception of
our transformation. Moreover, 95 percent of our 186-member Global
Leadership Team has attained Green Belt certifi cation.
Operating cash fl ow from continuing operations for our manufac-
turing businesses totaled $1.2 billion, allowing us to invest
$391 million in new capital expenditures for continued future
growth. And we’re seeing the results, with return on invested
capital growing to 24.8 percent. We’re making prudent investments
in capacity, new product research and development, and market
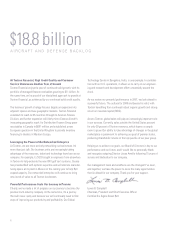
development that both drive and support organic growth. Our record
$18.8 billion aircraft and defense backlog is proof that these
investments are paying off.
Textron provided owners a total market return of 54 percent in 2007,
far surpassing the fi ve percent return of the S&P 500 Index. This
performance refl ects the strength of returns for our end markets and
advancements in our businesses across the enterprise.
Bell Helicopter on Long-Term Upswing; Textron Systems
Broadens Its Precision Engagement Capabilities
Our Bell segment, composed of Bell Helicopter and Textron Systems,
posted revenues of $3.9 billion in 2007. Based on current projec-
tions, we expect segment revenues to exceed $5 billion by 2010.
Bell Helicopter’s business is clearly on a long-term upswing, with
signifi cant demand coming from both the military and commercial
sectors at the same time. In fact, we delivered 181 commercial
helicopters during the year, up from 159 in 2006.
There are a number of factors at play here. The helicopter industry
is entering its fi rst signifi cant replacement cycle, with 40 percent
of today’s fl eet more than 25 years old. We are also seeing a rise in
exploration and production for oil and other natural resources in
increasingly remote areas, where helicopters play an important role.
Additionally, helicopter sales are benefi ting from rising demand in
Asia and from an increase in use for emergency medical services,
law enforcement, disaster relief and the global war on terror.
3
$796 million
FREE CASH FLOW*
*Free Cash Flow is defi ned in footnote (2) on page 18.