E-Z-GO 2004 Annual Report Download - page 10
Download and view the complete annual report
Please find page 10 of the 2004 E-Z-GO annual report below. You can navigate through the pages in the report by either clicking on the pages listed below, or by using the keyword search tool below to find specific information within the annual report.-
 1
1 -
 2
2 -
 3
3 -
 4
4 -
 5
5 -
 6
6 -
 7
7 -
 8
8 -
 9
9 -
 10
10 -
 11
11 -
 12
12 -
 13
13 -
 14
14 -
 15
15 -
 16
16 -
 17
17 -
 18
18 -
 19
19 -
 20
20 -
 21
21 -
22
-
23
-
24
-
25
-
26
-
27
-
28
-
29
-
30
-
31
-
32
-
33
-
34
-
35
-
36
-
37
-
38
-
39
-
40
-
41
-
42
-
43
-
44
-
45
-
46
-
47
-
48
-
49
-
50
-
51
-
52
-
53
-
54
-
55
-
56
-
57
-
58
-
59
-
60
-
61
-
62
-
63
-
64
-
65
-
66
-
67
-
68
-
69
-
70
-
71
-
72
-
73
-
74
-
75
-
76
-
77
-
78
-
79
-
80
-
81
-
82
-
83
-
84
-
85
-
86
-
87
-
88
-
89
-
90
-
91
-
92
-
93
-
94
-
95
-
96
-
97
-
98
-
99
-
100
-
101
-
102
 |
 |

decade, we recently established an extensive IT infrastructure sourcing
partnership with Computer Sciences Corporation designed to generate
further long-term savings across Textron.
We’re realizing significant ongoing business process improvements,
underpinned by our Shared Service organizations, including a
consolidation of more than 1,500 separate payrolls and multiple payroll
system providers in North America and the U.K. to just three today.
In addition, a total reengineering of our healthcare offerings brought us
from 152 separate plans from multiple providers to one provider with
several options for all North American, non-bargained employees.
In addition, our new HR Invent infrastructure – a reinvention of our
HR service delivery model – provides common, Web-based, self-service
capabilities to Textron employees. This has yielded a dramatically more
efficient method to deliver and manage employee benefits.
Portfolio Management As we’ve focused on generating results
through our Enterprise Management initiatives, we have also honed our
Portfolio Management capabilities. Simultaneously, we are taking
strategic actions to simplify our business mix to deliver greater future
returns and growth to our shareholders.
We’ve created new acquisition criteria, conducted an in-depth analysis
of our portfolio and produced detailed plans for each of our businesses,
in addition to developing a more comprehensive acquisition integration
process.
Since 2001, we’ve divested more than $2.4 billion of annual non-core
manufacturing revenues and $1.3 billion of non-core finance assets
that did not meet our growth criteria. This has enabled us to allocate
additional management attention and capital toward our faster-growing,
more strategic businesses.
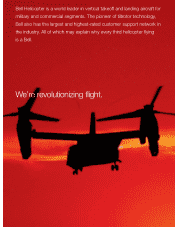
While modest in scope, we’ve concentrated our more recent acquisitive
activity on complementary growth areas through acquisitions such as
Acadian Composites to advance our helicopter after-market growth
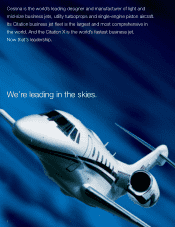
strategy; our increased stake to 75 percent ownership in the
CitationShares joint venture to expand participation in the growing
fractional jet market; and our joint venture between Greenlee and
Rothenberger AG to advance our presence in the North American
plumbing tools arena.
The Power to Grow Across all Textron businesses, there are exciting
developments that signal a bright future indeed. The following pages
provide a snapshot of how our segments are positioned to deliver
profitable growth through the second half of the decade and beyond,
including examples of how our businesses are benefiting from our
enterprise-wide initiatives, reflecting the value of our networked
enterprise.
We’re infusing Textron with a focus on value by incorporating value
management principles into our strategic planning and leadership
compensation processes to ensure the achievement of aggressive goals in
customer satisfaction and shareholder value creation.
The powerful combination of strong businesses and a value-adding net-
work gives us confidence that over the next several years, we can achieve
a return on invested capital of at least 14 percent while consistently
yielding compound earnings per share growth of 15 to 20 percent.
This year, and the rest of the decade, will be an exciting time of growth
for Textron. We have an undeniable sense of enthusiasm for the promise
of our future, and we remain relentless in the pursuit of our vision to
become the premier multi-industry company. Our talented workforce –
the primary agent of transformation over these past four years –
has become more committed to this vision with each and every step.
Thank you for your continued support.
Lewis B. Campbell
Chairman, President and Chief Executive Officer
8
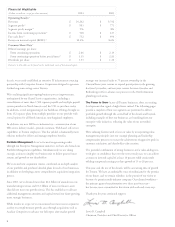
Financial Highlights
(Dollars in millions, except per share amounts) 2004 2003
Operating Results(1)
Revenues $ 10,242 $ 9,792
Segment profit(2) $ 903 $ 771
Segment profit margin(2) 9% 8%
Income from continuing operations(3) $ 528 $ 417
Free cash flow(4) $ 752 $ 494
Return on invested capital (ROIC)(5) 10.4% 8.6%
Common Share Data(1)
Diluted earnings per share:
From continuing operations $ 2.66 $ 2.13
From continuing operations before special items(6) $ 3.35 $ 2.83
Dividends per share $ 1.33 $ 1.30
Footnotes to this table can be found on the inside back cover of this annual report.