Dollar General 2011 Annual Report Download - page 24
Download and view the complete annual report
Please find page 24 of the 2011 Dollar General annual report below. You can navigate through the pages in the report by either clicking on the pages listed below, or by using the keyword search tool below to find specific information within the annual report.-
 1
1 -
2
-
3
-
4
-
5
-
6
-
7
-
8
-
9
-
10
-
11
-
12
-
13
-
 14
14 -
 15
15 -
 16
16 -
 17
17 -
 18
18 -
 19
19 -
 20
20 -
 21
21 -
 22
22 -
 23
23 -
 24
24 -
 25
25 -
 26
26 -
 27
27 -
 28
28 -
 29
29 -
 30
30 -
 31
31 -
 32
32 -
 33
33 -
 34
34 -
35
-
36
-
37
-
38
-
39
-
40
-
41
-
42
-
43
-
44
-
45
-
46
-
47
-
48
-
49
-
50
-
51
-
52
-
53
-
54
-
55
-
56
-
57
-
58
-
59
-
60
-
61
-
62
-
63
-
64
-
65
-
66
-
67
-
68
-
69
-
70
-
71
-
72
-
73
-
74
-
75
-
76
-
77
-
78
-
79
-
80
-
81
-
82
-
83
-
84
-
85
-
86
-
87
-
88
-
89
-
90
-
91
-
92
-
93
-
94
-
95
-
96
-
97
-
98
-
99
-
100
-
101
-
102
-
103
-
104
-
105
-
106
-
107
-
108
-
109
-
110
-
111
-
112
-
113
-
114
-
115
-
116
-
117
-
118
-
119
-
120
-
121
-
122
-
123
-
124
-
125
-
126
-
127
-
128
-
129
-
130
-
131
-
132
-
133
-
134
-
135
-
136
-
137
-
138
-
139
-
140
-
141
-
142
-
143
-
144
-
145
-
146
-
147
-
148
-
149
-
150
-
151
-
152
-
153
-
154
-
155
-
156
-
157
-
158
-
159
-
160
-
161
-
162
-
163
-
164
-
165
-
166
-
167
-
168
-
169
-
170
-
171
-
172
-
173
-
174
-
175
-
176
-
177
-
178
-
179
-
180
-
181
-
182
-
183
-
184
-
185
-
186
-
187
-
188
-
189
-
190
-
191
-
192
-
193
-
194
-
195
-
196
-
197
-
198
-
199
-
200
-
201
-
202
-
203
-
204
-
205
-
206
-
207
-
208
-
209
-
210
-
211
-
212
-
213
-
214
-
215
-
216
-
217
-
218
-
219
-
220
 |
 |

Proxy
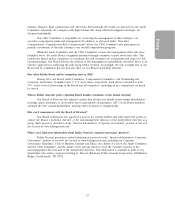
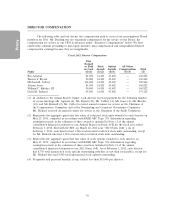
DIRECTOR COMPENSATION
The following table and text discuss the compensation paid to each of our non-employee Board
members for 2011. Mr. Dreiling was not separately compensated for his service on the Board; his
compensation for service as our CEO is discussed under ‘‘Executive Compensation’’ below. We have
omitted the columns pertaining to non-equity incentive plan compensation and nonqualified deferred
compensation earnings because they are inapplicable.
Fiscal 2011 Director Compensation
Fees
Earned
or Paid Stock Option All Other
in Cash Awards Awards Compensation Total
Name ($)(1) ($)(2) ($)(3) ($)(4) ($)
Raj Agrawal 81,000 34,420 45,402 — 160,822
Warren F. Bryant 90,000 34,420 45,402 — 169,822
Michael M. Calbert 106,000 34,420 45,402 — 185,822
Adrian Jones 81,000 34,420 45,402 — 160,822
William C. Rhodes, III 90,000 34,420 45,402 — 169,822
David B. Rickard 95,500 34,420 45,402 — 175,322
(1) In addition to the annual Board retainer, each director received payment for the following number
of excess meetings: Mr. Agrawal (4); Mr. Bryant (10); Mr. Calbert (4); Mr. Jones (4); Mr. Rhodes
(10); and Mr. Rickard (2). Mr. Calbert received annual retainers for service as the Chairman of
the Compensation Committee and of the Nominating and Corporate Governance Committee.
Mr. Rickard received an annual retainer for service as the Chairman of the Audit Committee.
(2) Represents the aggregate grant date fair value of restricted stock units awarded to each director on
May 25, 2011, computed in accordance with FASB ASC Topic 718. Information regarding
assumptions made in the valuation of these awards is included in Note 11 of the annual
consolidated financial statements in our Annual Report on Form 10-K for the fiscal year ended
February 3, 2012, filed with the SEC on March 22, 2012 (our ‘‘2011 Form 10-K’’). As of
February 3, 2012, each director had 1,546 total unvested restricted stock units outstanding, except
for Mr. Rickard who had 1,524 total unvested restricted stock units outstanding.
(3) Represents the aggregate grant date fair value of stock options awarded to each director on
May 25, 2011, computed in accordance with FASB ASC Topic 718. Information regarding
assumptions made in the valuation of these awards is included in Note 11 of the annual
consolidated financial statements in our 2011 Form 10-K. As of February 3, 2012, each director
had 8,743 total unexercised stock options outstanding (whether or not then exercisable), except for
Mr. Rickard who had 8,500 total unexercised stock options outstanding.
(4) Perquisites and personal benefits, if any, totaled less than $10,000 per director.
16