Dollar General 2011 Annual Report Download - page 193
Download and view the complete annual report
Please find page 193 of the 2011 Dollar General annual report below. You can navigate through the pages in the report by either clicking on the pages listed below, or by using the keyword search tool below to find specific information within the annual report.-
 1
1 -
 2
2 -
 3
3 -
 4
4 -
 5
5 -
 6
6 -
 7
7 -
 8
8 -
 9
9 -
 10
10 -
 11
11 -
 12
12 -
 13
13 -
 14
14 -
 15
15 -
 16
16 -
 17
17 -
 18
18 -
 19
19 -
 20
20 -
 21
21 -
 22
22 -
 23
23 -
 24
24 -
 25
25 -
 26
26 -
 27
27 -
 28
28 -
 29
29 -
 30
30 -
 31
31 -
 32
32 -
 33
33 -
 34
34 -
 35
35 -
 36
36 -
 37
37 -
 38
38 -
 39
39 -
 40
40 -
 41
41 -
 42
42 -
 43
43 -
 44
44 -
 45
45 -
 46
46 -
 47
47 -
 48
48 -
 49
49 -
 50
50 -
 51
51 -
 52
52 -
 53
53 -
 54
54 -
 55
55 -
 56
56 -
 57
57 -
 58
58 -
 59
59 -
 60
60 -
 61
61 -
 62
62 -
 63
63 -
 64
64 -
 65
65 -
 66
66 -
 67
67 -
 68
68 -
 69
69 -
 70
70 -
 71
71 -
 72
72 -
 73
73 -
 74
74 -
 75
75 -
 76
76 -
 77
77 -
 78
78 -
 79
79 -
 80
80 -
 81
81 -
 82
82 -
 83
83 -
 84
84 -
 85
85 -
 86
86 -
 87
87 -
 88
88 -
 89
89 -
 90
90 -
 91
91 -
 92
92 -
 93
93 -
 94
94 -
 95
95 -
 96
96 -
 97
97 -
 98
98 -
 99
99 -
 100
100 -
 101
101 -
 102
102 -
 103
103 -
 104
104 -
 105
105 -
 106
106 -
 107
107 -
 108
108 -
 109
109 -
 110
110 -
 111
111 -
 112
112 -
 113
113 -
 114
114 -
 115
115 -
 116
116 -
 117
117 -
 118
118 -
 119
119 -
 120
120 -
 121
121 -
 122
122 -
 123
123 -
 124
124 -
 125
125 -
 126
126 -
 127
127 -
 128
128 -
 129
129 -
 130
130 -
 131
131 -
 132
132 -
 133
133 -
 134
134 -
 135
135 -
 136
136 -
 137
137 -
 138
138 -
 139
139 -
 140
140 -
 141
141 -
 142
142 -
 143
143 -
 144
144 -
 145
145 -
 146
146 -
 147
147 -
 148
148 -
 149
149 -
 150
150 -
 151
151 -
 152
152 -
 153
153 -
 154
154 -
 155
155 -
 156
156 -
 157
157 -
 158
158 -
 159
159 -
 160
160 -
 161
161 -
 162
162 -
 163
163 -
 164
164 -
 165
165 -
 166
166 -
 167
167 -
 168
168 -
 169
169 -
 170
170 -
 171
171 -
 172
172 -
 173
173 -
 174
174 -
 175
175 -
 176
176 -
 177
177 -
 178
178 -
 179
179 -
 180
180 -
 181
181 -
 182
182 -
 183
183 -
 184
184 -
 185
185 -
 186
186 -
 187
187 -
 188
188 -
 189
189 -
 190
190 -
 191
191 -
 192
192 -
 193
193 -
 194
194 -
 195
195 -
 196
196 -
 197
197 -
 198
198 -
 199
199 -
 200
200 -
 201
201 -
 202
202 -
 203
203 -
 204
204 -
 205
205 -
 206
206 -
 207
207 -
 208
208 -
 209
209 -
 210
210 -
 211
211 -
 212
212 -
 213
213 -
 214
214 -
 215
215 -
 216
216 -
 217
217 -
 218
218 -
 219
219 -
 220
220
 |
 |

10-K
DOLLAR GENERAL CORPORATION AND SUBSIDIARIES
NOTES TO CONSOLIDATED FINANCIAL STATEMENTS (Continued)
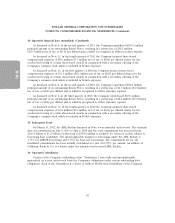
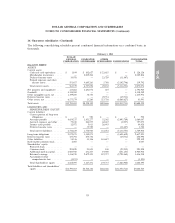
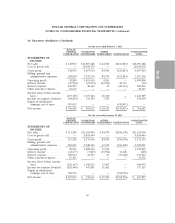
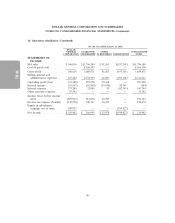
16. Guarantor subsidiaries (Continued)
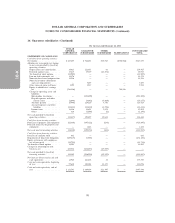
The following consolidating schedules present condensed financial information on a combined basis, in
thousands.
February 3, 2012
DOLLAR
GENERAL GUARANTOR OTHER CONSOLIDATED
CORPORATION SUBSIDIARIES SUBSIDIARIES ELIMINATIONS TOTAL
BALANCE SHEET:
ASSETS
Current assets:
Cash and cash equivalents .... $ 1,844 $ 102,627 $ 21,655 $ — $ 126,126
Merchandise inventories ..... — 2,009,206 — — 2,009,206
Deferred income taxes ...... 10,078 — 21,729 (31,807) —
Prepaid expenses and other
current assets ........... 551,457 4,685,263 5,768 (5,102,746) 139,742
Total current assets ......... 563,379 6,797,096 49,152 (5,134,553) 2,275,074
Net property and equipment .... 113,661 1,681,072 227 — 1,794,960
Goodwill ................. 4,338,589 — — — 4,338,589
Other intangible assets, net ..... 1,199,200 36,754 — — 1,235,954
Deferred income taxes ........ — — 49,531 (49,531) —
Other assets, net ............ 6,575,574 13,260 323,736 (6,868,627) 43,943
Total assets ............... $12,790,403 $8,528,182 $422,646 $(12,052,711) $9,688,520
LIABILITIES AND
SHAREHOLDERS’ EQUITY
Current liabilities:
Current portion of long-term
obligations ............. $ — $ 590 $ — $ — $ 590
Accounts payable .......... 4,654,237 1,451,277 52,362 (5,093,789) 1,064,087
Accrued expenses and other . . . 79,010 264,575 62,447 (8,957) 397,075
Income taxes payable ....... 12,972 5,013 26,443 — 44,428
Deferred income taxes ...... — 35,529 — (31,807) 3,722
Total current liabilities ....... 4,746,219 1,756,984 141,252 (5,134,553) 1,509,902
Long-term obligations ........ 2,879,475 3,340,075 — (3,601,659) 2,617,891
Deferred income taxes ........ 435,791 270,736 — (49,531) 656,996
Other liabilities ............. 54,336 33,156 141,657 — 229,149
Redeemable common stock ..... 6,087 — — — 6,087
Shareholders’ equity:
Preferred stock ........... — — — — —
Common stock ........... 295,828 23,855 100 (23,955) 295,828
Additional paid-in capital ..... 2,960,940 431,253 19,900 (451,153) 2,960,940
Retained earnings ......... 1,416,918 2,672,123 119,737 (2,791,860) 1,416,918
Accumulated other
comprehensive loss ....... (5,191) — — — (5,191)
Total shareholders’ equity .... 4,668,495 3,127,231 139,737 (3,266,968) 4,668,495
Total liabilities and shareholders’
equity ................. $12,790,403 $8,528,182 $422,646 $(12,052,711) $9,688,520
93
