DELPHI 2015 Annual Report Download - page 11
Download and view the complete annual report
Please find page 11 of the 2015 DELPHI annual report below. You can navigate through the pages in the report by either clicking on the pages listed below, or by using the keyword search tool below to find specific information within the annual report.-
 1
1 -
 2
2 -
 3
3 -
 4
4 -
 5
5 -
 6
6 -
 7
7 -
 8
8 -
 9
9 -
 10
10 -
 11
11 -
 12
12 -
 13
13 -
 14
14 -
 15
15 -
 16
16 -
 17
17 -
 18
18 -
 19
19 -
 20
20 -
 21
21 -
 22
22 -
23
-
24
-
25
-
26
-
27
-
28
-
29
-
30
-
31
-
32
-
33
-
34
-
35
-
36
-
37
-
38
-
39
-
40
-
41
-
42
-
43
-
44
-
45
-
46
-
47
-
48
-
49
-
50
-
51
-
52
-
53
-
54
-
55
-
56
-
57
-
58
-
59
-
60
-
61
-
62
-
63
-
64
-
65
-
66
-
67
-
68
-
69
-
70
-
71
-
72
-
73
-
74
-
75
-
76
-
77
-
78
-
79
-
80
-
81
-
82
-
83
-
84
-
85
-
86
-
87
-
88
-
89
-
90
-
91
-
92
-
93
-
94
-
95
-
96
-
97
-
98
-
99
-
100
-
101
-
102
-
103
-
104
-
105
-
106
-
107
-
108
-
109
-
110
-
111
-
112
-
113
-
114
-
115
-
116
-
117
-
118
-
119
-
120
-
121
-
122
-
123
-
124
-
125
-
126
-
127
-
128
-
129
-
130
-
131
-
132
-
133
-
134
-
135
-
136
-
137
-
138
-
139
-
140
-
141
-
142
-
143
-
144
-
145
-
146
-
147
-
148
-
149
-
150
-
151
-
152
-
153
-
154
-
155
-
156
-
157
-
158
-
159
-
160
-
161
-
162
-
163
-
164
-
165
-
166
-
167
-
168
-
169
-
170
-
171
-
172
 |
 |

11
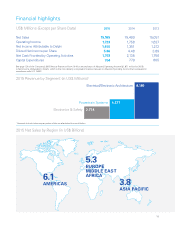
Financial highlights
2015 Net Sales by Region (in US$ Billions)
6.1
5.3
3.8
AMERICAS
EUROPE
MIDDLE EAST
AFRICA
ASIA PACIFIC
US$ Millions (Except per Share Data) 2015 2014 2013
2015 Revenue by Segment (in US$ Millions)1
Powertrain Systems
Electrical/Electronic Architecture
Net Sales
Operating Income
Net Income Attributable to Delphi
Diluted Net Income per Share
Net Cash Provided by Operating Activities
Capital Expenditures
See page 134 of the Company’s 2015 Annual Report on Form 10-K for reconciliation of Adjusted Operating Income ($1,971 million for 2015)
to Net Income attributable to Delphi, which is the most directly comparable financial measure to Adjusted Operating Income that is prepared in
accordance with U.S. GAAP.
15,165
1,723
1,450
5.06
1,703
704
15,499
1,758
1,351
4.48
2,13 5
779
15,051
1,627
1,212
3.89
1,750
605
8,180
4,377
1 Amounts include intercompany sales which are eliminated in consolidation.
Electronics & Safety 2,774