Creative 2008 Annual Report Download - page 4
Download and view the complete annual report
Please find page 4 of the 2008 Creative annual report below. You can navigate through the pages in the report by either clicking on the pages listed below, or by using the keyword search tool below to find specific information within the annual report.-
 1
1 -
 2
2 -
 3
3 -
 4
4 -
 5
5 -
 6
6 -
 7
7 -
 8
8 -
 9
9 -
 10
10 -
 11
11 -
 12
12 -
 13
13 -
 14
14 -
 15
15 -
16
-
17
-
18
-
19
-
20
-
21
-
22
-
23
-
24
-
25
-
26
-
27
-
28
-
29
-
30
-
31
-
32
-
33
-
34
-
35
-
36
-
37
-
38
-
39
-
40
-
41
-
42
-
43
-
44
-
45
-
46
-
47
-
48
 |
 |

4
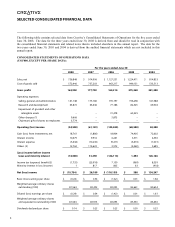
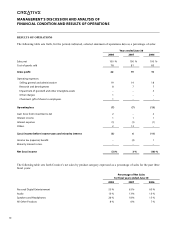
The following table contains selected data from Creative’s Consolidated Statements of Operations for the five years ended
June 30, 2008. The data for the three years ended June 30, 2008 is derived from and should be read in conjunction with
the consolidated financial statements and related notes thereto included elsewhere in this annual report. The data for the
two years ended June 30, 2005 and 2004 is derived from the audited financial statements which are not included in this
annual report.
CONSOLIDATED STATEMENTS OF OPERATIONS DATA
(US$’000, EXCEPT PER SHARE DATA):
FortheyearsendedJune30
2008 2007 2006 2005 2004
Sales,net $ 736,848 $ 914,906 $ 1,127,531 $ 1,224,411 $ 814,853
Costofgoodssold 572,946 737,203 963,217 949,151 533,513
Grossprofit 163,902 177,703 164,314 275,260 281,340
Operatingexpenses:
Selling,generalandadministrative 141,148 175,180 195,197 196,258 167,588
Researchanddevelopment 63,872 63,646 77,186 82,325 69,504
Impairmentofgoodwillandother
intangibleassets – – 31,478 65,225 –
Othercharges(1) 9,666 – 5,873 – –
Chairman’sgiftofsharestoemployees 3,774 – – – –
Operating(loss)income (54,558) (61,123) (145,420) (68,548) 44,248
Gain(loss)frominvestments,net 18,761 (1,880) 18,904 74,405 72,602
Interestincome 10,679 9,916 6,241 3,571 4,592
Interestexpense (5,644) (10,245) (9,411) (3,674) (1,001)
Others(2) 12,762 114,622 3,572 (4,260) 5,685
(Loss)incomebeforeincome
taxesandminorityinterest (18,000) 51,290 (126,114) 1,494 126,126
Incometax(expense)benefit(3) (1,735) (23,918) 7,150 (969) 8,539
Minorityinterestinloss(income) 1 817 805 63 (418)
Net(loss)income $ (19,734) $ 28,189 $(118,159) $ 588 $ 134,247
Basic(loss)earningspershare $ (0.24) $ 0.34 $ (1.42) $ 0.01 $ 1.66
Weightedaverageordinaryshares
outstanding(‘000) 81,564 83,452 83,093 82,661 80,654
Diluted(loss)earningspershare $ (0.24) $ 0.34 $ (1.42) $ 0.01 $ 1.61
Weightedaverageordinaryshares
andequivalentsoutstanding(‘000) 81,564 83,913 83,093 85,333 83,630
Dividendsdeclaredpershare $ 0.14 $ 0.25 $ 0.25 $ 0.50 $ 0.25
SELECTEDCONSOLIDATEDFINANCIALDATA