Creative 2008 Annual Report Download - page 11
Download and view the complete annual report
Please find page 11 of the 2008 Creative annual report below. You can navigate through the pages in the report by either clicking on the pages listed below, or by using the keyword search tool below to find specific information within the annual report.-
 1
1 -
 2
2 -
 3
3 -
 4
4 -
 5
5 -
 6
6 -
 7
7 -
 8
8 -
 9
9 -
 10
10 -
 11
11 -
 12
12 -
 13
13 -
 14
14 -
 15
15 -
 16
16 -
 17
17 -
 18
18 -
 19
19 -
 20
20 -
 21
21 -
 22
22 -
23
-
24
-
25
-
26
-
27
-
28
-
29
-
30
-
31
-
32
-
33
-
34
-
35
-
36
-
37
-
38
-
39
-
40
-
41
-
42
-
43
-
44
-
45
-
46
-
47
-
48
 |
 |

11
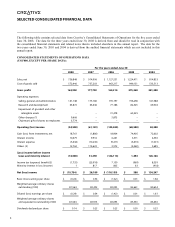
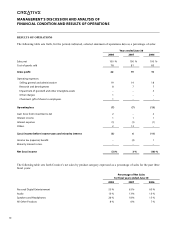
YEAR ENDED JUNE 30, 2008 COMPARED TO YEAR ENDED JUNE 30, 2007
Net sales
Net sales for the year ended June 30, 2008 decreased by 19% compared to the year ended June 30, 2007 mainly due to lower
sales of personal digital entertainment (“PDE”) products. Sales of PDE products, which include digital audio players and
digital cameras, decreased by 33% compared to fiscal year 2007 and represented 53% of sales in fiscal year 2008 compared
to 63% of sales in fiscal year 2007. The decrease in sales of PDE products was primarily attributable to lower average
selling prices of digital audio players resulting from product mix and competitive pricing, and management’s decision to
streamline the company’s lineup of digital audio players to focus on strategic and more profitable products. Sales of audio
products, which consist of Sound Blaster audio cards and chipsets, decreased by 12% compared to fiscal year 2007 and
represented 13% of sales in fiscal years 2008 and 2007. Sales of speakers and headphones increased by 13% in fiscal year
2008 compared to fiscal year 2007 and represented 26% of sales in fiscal year 2008 compared to 18% in fiscal year 2007.
The increase was mainly contributed by an increased in sales of headphones. Sales from all other products, which include
graphics products, communication products, accessories and other miscellaneous items, increased by 14% compared to fiscal
year 2007 and represented 8% of sales in fiscal year 2008 and 6% in fiscal year 2007.
Gross profit
Gross profit in fiscal year 2008 was 22% of sales compared to 19% in fiscal year 2007. Gross profit at 22% in fiscal year
2008 was consistent with the mix of products sold during the fiscal year.
Operating expenses
In line with the decrease in sales and management’s efforts to reduce operating costs, selling, general and administrative
(“SG&A”) expenses in fiscal year 2008 decreased by 19% compared to fiscal year 2007. As a percentage of sales, SG&A
expenses were 19% of sales in fiscal years 2008 and 2007.
Research and development (“R&D”) expenses were comparable in fiscal years 2008 and 2007, and as a percentage of sales
were 8% in fiscal year 2008 and 7% in fiscal year 2007. R&D expenses in fiscal year 2008 remained at the same level
as compared to fiscal year 2007 even though net sales have decreased because of spending on new product development
in fiscal year 2008.
Other charges of $9.7 million for fiscal year 2008 relate to restructuring charges incurred to streamline the business operation
of the group, and the charges comprised mainly employee severance costs and other exit costs pertaining mainly to lease
cancelations. See Note 13 of “Notes to Consolidated Financial Statements.”
Chairman’s gift of shares to employees of $3.8 million in fiscal year 2008 relates to Creative’s Chairman and CEO’s gift of
his personal Creative shares to the employees of Creative. In accordance with the US GAAP, the value of these Creative
shares was reported as a non-cash charge in the operating expenses of Creative.
Net investment gain (loss)
Net gain of $18.8 million in fiscal year 2008 comprised $34.4 million in net gain from sales of investments offset by $15.6
million in write-downs of mainly quoted investments. Bulk of the $34.4 million in net gain from sales of investments was
derived from the sale of shares in subsidiaries and equity accounted investments. The disposals of these investments were
in line with management’s goal of streamlining and improving operational efficiencies. Net loss of $1.9 million in fiscal
year 2007 was mainly due to $2.0 million in write-downs of investments.