Creative 2008 Annual Report Download - page 10
Download and view the complete annual report
Please find page 10 of the 2008 Creative annual report below. You can navigate through the pages in the report by either clicking on the pages listed below, or by using the keyword search tool below to find specific information within the annual report.-
 1
1 -
 2
2 -
 3
3 -
 4
4 -
 5
5 -
 6
6 -
 7
7 -
 8
8 -
 9
9 -
 10
10 -
 11
11 -
 12
12 -
 13
13 -
 14
14 -
 15
15 -
 16
16 -
 17
17 -
 18
18 -
 19
19 -
 20
20 -
 21
21 -
22
-
23
-
24
-
25
-
26
-
27
-
28
-
29
-
30
-
31
-
32
-
33
-
34
-
35
-
36
-
37
-
38
-
39
-
40
-
41
-
42
-
43
-
44
-
45
-
46
-
47
-
48
 |
 |

10
MANAGEMENT’SDISCUSSIONANDANALYSISOF
FINANCIALCONDITIONANDRESULTSOFOPERATIONS
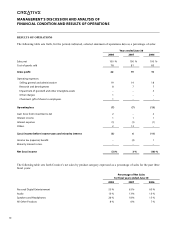
RESULTS OF OPERATIONS
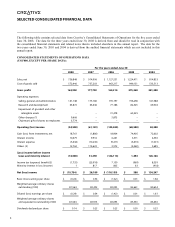
The following table sets forth, for the periods indicated, selected statement of operations data as a percentage of sales:
YearsendedJune30
2008 2007 2006
Sales,net 100% 100% 100%
Costofgoodssold 78 81 85
Grossprofit 22 19 15
Operatingexpenses:
Selling,generalandadministrative 19 19 18
Researchanddevelopment 8 7 7
Impairmentofgoodwillandotherintangibleassets – – 3
Othercharges 1 – –
Chairman’sgiftofsharestoemployees 1 – –
Operatingloss (7) (7) (13)
Gain(loss)frominvestments,net 2 – 2
Interestincome 1 1 1
Interestexpense (1) (1) (1)
Others 2 13 –
(Loss)incomebeforeincometaxesandminorityinterest (3) 6 (11)
Incometax(expense)benefit – (3) 1
Minorityinterestinloss – – –
Net(loss)income (3)% 3% (10)%
The following table sets forth Creative’s net sales by product category expressed as a percentage of sales for the past three
fiscal years:
PercentageofNetSales
forfiscalyearsendedJune30
2008 2007 2006
PersonalDigitalEntertainment 53% 63% 65%
Audio 13% 13% 13%
SpeakersandHeadphones 26% 18% 15%
AllOtherProducts 8% 6% 7%