Creative 2006 Annual Report Download - page 16
Download and view the complete annual report
Please find page 16 of the 2006 Creative annual report below. You can navigate through the pages in the report by either clicking on the pages listed below, or by using the keyword search tool below to find specific information within the annual report.-
 1
1 -
2
-
3
-
4
-
5
-
 6
6 -
 7
7 -
 8
8 -
 9
9 -
 10
10 -
 11
11 -
 12
12 -
 13
13 -
 14
14 -
 15
15 -
 16
16 -
 17
17 -
 18
18 -
 19
19 -
 20
20 -
 21
21 -
 22
22 -
 23
23 -
 24
24 -
 25
25 -
 26
26 -
27
-
28
-
29
-
30
-
31
-
32
-
33
-
34
-
35
-
36
-
37
-
38
-
39
-
40
-
41
-
42
-
43
-
44
-
45
-
46
-
47
-
48
 |
 |

16
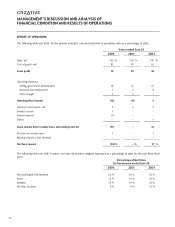
Unaudited data for quarters ended (as a percentage of sales)
Jun 30 Mar 31 Dec 31 Sep 30 Jun 30 Mar 31 Dec 31 Sep 30
2006 2006 2005 2005 2005 2005 2004 2004
Sales,net 100% 100% 100% 100% 100% 100% 100% 100%
Costofgoodssold 86 105 78 80 90 77 73 69
Grossprofit 14 (5) 22 20 10 23 27 31
OperatingExpenses:
Selling,generaland
administrative 18 23 14 16 16 15 15 19
Researchanddevelopment 7 8 6 7 6 6 6 10
Impairmentofgoodwill/
intangibleassets – 17 – – – – 17 –
Operating(loss)income (11) (53) 2 (3) (12) 2 (11) 2
Net(loss)gainfrominvestments – 1 2 4 3 5 14 (1)
Interestincome 1 1 – – – – – –
Interestexpense (1) (1) (1) (1) – – – –
Others 2 1 (1) – (2) (2) 1 1
(Loss)incomebeforeincome
taxesandminorityinterest (9) (51) 2 – (11) 5 4 2
Provisionforincometaxes 3 – – – 1 – (1) –
Minorityinterestin(income)loss – – – – – – – –
Net(loss)income (6)% (51)% 2% –% (10)% 5% 3% 2%
MANAGEMENT’S DISCUSSION AND ANALYSIS OF
FINANCIAL CONDITION AND RESULTS OF OPERATIONS
LIQUIDITYANDCAPITALRESOURCES
CashandcashequivalentsatJune30,2006were$214.0millioncomparedtothebalanceof$187.2millionatJune30,2005.
OperatingActivities
Netcashprovidedbyoperatingactivitiesduringfiscalyear2006was$49.3millioncomparedwith$208.1millionusedinfiscal
year2005.Thecashprovidedbyoperatingactivitiesof$49.3millionwasmainlyduetoa$21.6millionnetdecreaseinaccounts
receivableandotherassetsandprepaidexpenses,a$161.0millionnetdecreaseininventoryanda$36.3millionadjustmentfor
non-cashitems.Thedecreaseininventorywasinlinewithmanagement’sintentiontomaintainalowerinventorybalance.Cash
providedbyoperatingactivitieswasoffsetpartiallyby a$49.6millionnetdecrease inaccountspayable andaccruedand other
liabilities.The$36.3millioninadjustmentstonon-cashitemscomprisedmainly$25.0millionofdepreciationandamortization,
$31.5millioninimpairmentofgoodwillandintangibleassets,offsetpartiallybya$20.9millioninnetgainsfromthedisposalof
investments.
Netcashusedinoperatingactivitiesduringfiscalyear2005was$208.1millioncomparedwith$22.8millioninfiscalyear2004.
Thecashusedinoperatingactivitiesof$208.1millionwasmainlyduetoa$96.2millionnetincreaseinaccountsreceivableand
otherassetsandprepaid expenses anda$212.0millionnet increase ininventory. AsofJune30,2005, Creative had$395.9
millionininventorycomparedto$183.9millionininventoryasofJune30,2004.Creativebuiltupitsinventorytobetterposition