Creative 2006 Annual Report Download - page 15
Download and view the complete annual report
Please find page 15 of the 2006 Creative annual report below. You can navigate through the pages in the report by either clicking on the pages listed below, or by using the keyword search tool below to find specific information within the annual report.-
 1
1 -
2
-
3
-
4
-
 5
5 -
 6
6 -
 7
7 -
 8
8 -
 9
9 -
 10
10 -
 11
11 -
 12
12 -
 13
13 -
 14
14 -
 15
15 -
 16
16 -
 17
17 -
 18
18 -
 19
19 -
 20
20 -
 21
21 -
 22
22 -
 23
23 -
 24
24 -
 25
25 -
26
-
27
-
28
-
29
-
30
-
31
-
32
-
33
-
34
-
35
-
36
-
37
-
38
-
39
-
40
-
41
-
42
-
43
-
44
-
45
-
46
-
47
-
48
 |
 |

15
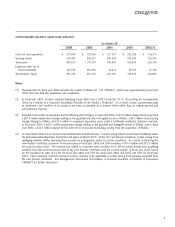
QUARTERLYRESULTS
ThefollowingisasummaryofCreative’sunauditedquarterlyresultsfortheeightquartersendedJune30,2006,togetherwiththe
percentageofsalesrepresentedbysuchresults.ConsistentwiththePCperipheralsanddigitalentertainmentmarkets,demand
forCreative’sproductsisgenerallystrongerinthequarterendedDecember31,comparedtoanyotherquarterofthefiscalyear
duetoconsumerbuyingpatterns.Inmanagement’sopinion,theresultsdetailedbelowhavebeenpreparedonabasisconsistent
withtheauditedfinancialstatementsandincludealladjustments,consistingonlyofnormalrecurringadjustments,necessaryfor
afairpresentationoftheinformationfortheperiodspresentedwhenreadinconjunctionwiththefinancialstatementsandnotes
theretocontainedelsewhereherein.Creative’sbusinessisseasonalinnatureandthequarterlyresultsarenotnecessarilyindicative
oftheresultstobeachievedinfuturequarters.
Unaudited data for quarters ended (in US$’000 except per share data)
Jun 30 Mar 31 Dec 31 Sep 30 Jun 30 Mar 31 Dec 31 Sep 30
2006 2006 2005 2005 2005 2005 2004 2004
Sales,net $ 230,875 $ 225,657$ 390,826$ 280,173$ 305,409$ 333,840$ 375,142 $ 210,020
Costofgoodssold 198,371 235,799 305,440 223,607 274,417 256,519 273,398 144,817
Grossprofit 32,504 (10,142) 85,386 56,566 30,992 77,321 101,744 65,203
Operatingexpenses:
Selling,generaland
administrative 42,753 51,959 55,220 45,265 48,051 51,208 56,931 40,068
Researchanddevelopment 15,682 18,843 22,734 19,927 20,300 19,687 22,620 19,718
Othercharges – 37,351 – – – – 65,225 –
Operating(loss)income (25,931) (118,295) 7,432 (8,626) (37,359) 6,426 (43,032) 5,417
Net(loss)gainfrominvestments (34) 2,030 6,880 10,028 9,304 14,766 51,539 (1,204)
Interestincome 2,000 1,847 1,399 995 967 1,243 651 710
Interestexpense (2,701) (2,449) (2,244) (2,017) (1,792) (1,275) (456) (151)
Others 6,072 2,488 (5,140) 152 (4,796) (5,728) 5,555 709
(Loss)incomebeforeincome
taxesandminorityinterest (20,594) (114,379) 8,327 532 (33,676) 15,432 14,257 5,481
Provisionforincometaxes 7,632 (229) (115) (138) 1,855 (53) (2,236) (535)
Minorityinterestin
loss(income) 230 279 (1) 297 (123) 534 (178) (170)
Net(loss)income $ (12,732) $ (114,329)$ 8,211 $ 691 $ (31,944)$ 15,913 $ 11,843$ 4,776
Basic(loss)earningspershare $ (0.15) $ (1.38)$ 0.10 $ 0.01 $ (0.38)$ 0.19 $ 0.14 $ 0.06
Weightedaverageordinary
sharesoutstanding(’000) 83,179 82,895 82,740 83,556 83,576 83,307 82,320 81,443
Diluted(loss)earningspershare $ (0.15) $ (1.38)$ 0.10 $ 0.01 $ (0.38) $ 0.18 $ 0.14 $ 0.06
Weightedaverageordinary
sharesandequivalents
outstanding(’000) 83,179 82,895 83,532 84,690 83,576 86,274 85,930 84,237