Cracker Barrel 2010 Annual Report Download - page 16
Download and view the complete annual report
Please find page 16 of the 2010 Cracker Barrel annual report below. You can navigate through the pages in the report by either clicking on the pages listed below, or by using the keyword search tool below to find specific information within the annual report.-
 1
1 -
2
-
3
-
4
-
5
-
 6
6 -
 7
7 -
 8
8 -
 9
9 -
 10
10 -
 11
11 -
 12
12 -
 13
13 -
 14
14 -
 15
15 -
 16
16 -
 17
17 -
 18
18 -
 19
19 -
 20
20 -
 21
21 -
 22
22 -
 23
23 -
 24
24 -
 25
25 -
 26
26 -
27
-
28
-
29
-
30
-
31
-
32
-
33
-
34
-
35
-
36
-
37
-
38
-
39
-
40
-
41
-
42
-
43
-
44
-
45
-
46
-
47
-
48
-
49
-
50
-
51
-
52
-
53
-
54
-
55
-
56
-
57
-
58
-
59
-
60
-
61
-
62
 |
 |

closer to two percent. With average yearly revenue per store of
about $4.1 million, you can see the potential sales growth,
especially if we can continue to improve the unit economics of
each new store and drive higher returns on investment.
As we accelerate unit development, we are working on
creating a new store prototype that combines the best
of what we have learned. To begin with, every new store will
include our Seat to Eat process. e Seat to Eat initiative
was aimed at serving each guest the correct order at the
appropriate temperature in less than een minutes. Seat to
Eat includes new equipment in the kitchen and training
for our employees. e store in Nicholasville, Kentucky, was
the rst to be opened with Seat to Eat, and results there
are very encouraging. We launched the Seat to Eat process
into our stores in three regions in scal 2010 and plan to
complete the roll out in the remaining seven regions during
scal 2011.
On the Path to Further Margin Improvement
Continuing the programs that were begun in 2009, in scal
2010 we adopted One Best Way to standardize execution at
every location every day, but especially on weekends when
we have our longest waits. e result is a system in which
managers and employees can measure their performance
every day. Our highly trained workforce, with turnover at
72 percent, is a major reason why we can deliver the
“Pleasing People” guest experience even during the peak
times of the day. And higher productivity per employee
is a key factor in improving our prot margins.
Our food management processes, from the sourcing
to the preparation of each menu oering to the management
of waste, have improved. We’re also looking for other ways,
such as reducing energy usage in the stores, to eliminate
unnecessary costs without negatively aecting the guest
experience. In retail, we can improve the routing and timing
of store deliveries to reduce freight costs. We plan to
build on the work we have done in 2010 to further improve
margins in 2011.
Manage Capital Structure to Build Value
We anticipate that our strong cash ow will fund all of our
capital needs, including higher capital expenditures for new
store growth, continued debt repayments, share repurchases
to oset dilution, and a competitive dividend. During scal
2010, we amended our primary credit agreement to extend the
maturity of $250 million of our outstanding long-term
debt to 2016. e remainder of the debt is due in 2013. e
extension improved our exibility to renance.
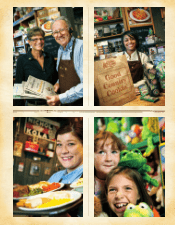
Living and Giving in the Community
We always strive to do beer. is includes Cracker Barrel’s
programs for giving back to the communities in which we
live and work. Our main focus is on education and diversity,
and most of what we do is in partnership with existing
charitable and social organizations. For example, we contin-
ued to develop and support the Rockin Reader® program
that we started in 2009 at 122 schools in seven states.
In 2010, the program expanded to 225 elementary schools
in 29 states where volunteers provided 56,000 hours of
time reading to children. e program was the winner of the
annual “Stars of the Industry” Awards, presented by the
Tennessee Hospitality Association for community relations
14