Cracker Barrel 2010 Annual Report Download - page 14
Download and view the complete annual report
Please find page 14 of the 2010 Cracker Barrel annual report below. You can navigate through the pages in the report by either clicking on the pages listed below, or by using the keyword search tool below to find specific information within the annual report.-
 1
1 -
2
-
3
-
 4
4 -
 5
5 -
 6
6 -
 7
7 -
 8
8 -
 9
9 -
 10
10 -
 11
11 -
 12
12 -
 13
13 -
 14
14 -
 15
15 -
 16
16 -
 17
17 -
 18
18 -
 19
19 -
 20
20 -
 21
21 -
 22
22 -
 23
23 -
 24
24 -
25
-
26
-
27
-
28
-
29
-
30
-
31
-
32
-
33
-
34
-
35
-
36
-
37
-
38
-
39
-
40
-
41
-
42
-
43
-
44
-
45
-
46
-
47
-
48
-
49
-
50
-
51
-
52
-
53
-
54
-
55
-
56
-
57
-
58
-
59
-
60
-
61
-
62
 |
 |

Not only did we grow our top line in 2010, we also
strengthened our business model by aacking costs through
both structural improvements and capturing the benets of
a favorable external environment. All of this was reected in
our strong nancial results. We reported 2010 EPS of $3.62,
up 25 percent from scal 2009. Revenue from continuing
operations increased 1.6 percent to $2.4 billion. Comparable
store restaurant sales increased 0.8 percent (including
the eect of a 2.0 percent higher check) from scal 2009,
and comparable store retail sales were down only 0.9 percent.
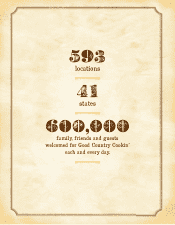
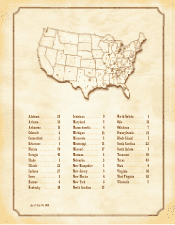
During the year, we opened net ve new Cracker Barrel
Old Country Store locations, expanding our chain to 593 units
at year-end.
We improved our operating margins to 6.8 percent,
compared with 6.0 percent in 2009. Eective execution of our
purchasing strategies led to a 2.5 percent reduction in our
food commodity costs in 2010. In the retail business, beer
merchandising meant that we took $18 million less in
markdowns for the year. We beneted from a reduction in
store management stang in our lower volume stores
under new operating standards, and beer productivity and
a new healthcare benets plan implemented at mid-year
helped reduce labor costs and related expenses overall.
e resulting 18 percent improvement in store operating
income allowed our store managers to earn higher bonuses,
improving management turnover and morale that, in turn,
positively aect our guest experiences. Importantly,
our improved guest satisfaction scores show that managing
the business tightly never jeopardized the all-important
guest experience.
While prots are a key measure of our success, cash
ow is the lifeblood of any company. Net cash from operating
activities was $212 million, which more than funded
$70 million of capital expenditures. During 2010,
we paid aggregate dividends of $0.80 per share for a total
$18.5 million, reduced our debt by $65 million,
and repurchased 1.35 million shares for $62.5 million.
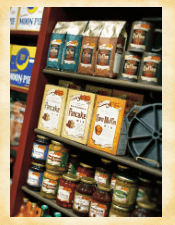
More Growth at the Front of the Store
ere aren’t too many other places these days other than
Cracker Barrel where you can walk right into an old
fashioned country store. is atmosphere creates a strong
emotional connection with the past, a signature of our
brand. With almost 1,000 guests per day in each of our stores,
we have the opportunity to oer a wide variety of gis,
snacks and impulse items to a large number of people.
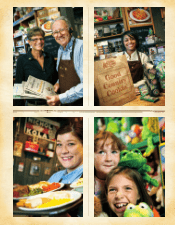
Today, our new mix of merchandise seems to be on the
right track. More guests are making purchases. Importantly,
we are operating at very ecient inventory levels. We are
executing a number of strategies that we believe will drive
continued growth in our retail business.
e Great Gis program that we introduced in 2010
crossed a number of merchandise categories. It included
picture frames over the Summer with a military theme
and frames for three and four generational pictures around
Mother’s Day. Pajama sets were very appealing at both
Christmas and Mother’s Day. Gis of Cracker Barrel-
branded food products and collegiate oerings worked for
every occasion. Motion toys, such as the Roll-Over
Laughing Dog and Animated Pet Fish, and musical toys
were also very popular throughout the year.
12