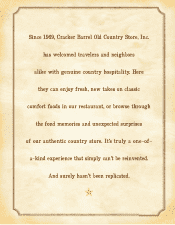
Cracker Barrel 2010 Annual Report Download - page 13
Download and view the complete annual report
Please find page 13 of the 2010 Cracker Barrel annual report below. You can navigate through the pages in the report by either clicking on the pages listed below, or by using the keyword search tool below to find specific information within the annual report.-
 1
1 -
2
-
 3
3 -
 4
4 -
 5
5 -
 6
6 -
 7
7 -
 8
8 -
 9
9 -
 10
10 -
 11
11 -
 12
12 -
 13
13 -
 14
14 -
 15
15 -
 16
16 -
 17
17 -
 18
18 -
 19
19 -
 20
20 -
 21
21 -
 22
22 -
 23
23 -
24
-
25
-
26
-
27
-
28
-
29
-
30
-
31
-
32
-
33
-
34
-
35
-
36
-
37
-
38
-
39
-
40
-
41
-
42
-
43
-
44
-
45
-
46
-
47
-
48
-
49
-
50
-
51
-
52
-
53
-
54
-
55
-
56
-
57
-
58
-
59
-
60
-
61
-
62
 |
 |

seven of the ten markets surveyed in which we have a
meaningful presence.
And for the ninth consecutive year, Cracker Barrel
was also selected as the most RV-friendly sit-down restaurant
in America by members of the Good Sam Club.
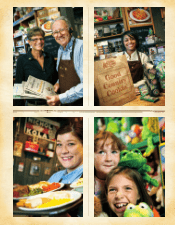
is kind of feedback arms the strength of our brand,
but we believe there’s even more tangible proof of Cracker
Barrel’s appeal. By providing our “Pleasing People”
experience to each guest through consistent execution,
new and appealing food oerings supported by advertising,
and beer merchandising on the retail side, we were able
to outperform the Knapp-Track™ trac index throughout
2010, extending that string to a total of sixteen consecutive
quarters. In the fourth quarter, our trac was positive
for the rst time since the rst quarter of 2007. And we did
it without discounting. We have maintained a positive
check throughout the recession, demonstrating that even in
these dicult economic times our approach of oering
honest value works. And to top things o, our retail sales
growth turned positive mid-year and grew almost three
percent in the second half of 2010.
ere’s something you need to remember about Cracker
Barrel. We’re always looking to do things beer, but we
tend to be cautious about making wholesale changes. at’s
why we test. Whether it’s a new menu item, a new kitchen
layout, or a new program to serve our guests more quickly,
we go to painstaking lengths to make sure that the eort
will produce the desired results before rolling it out across
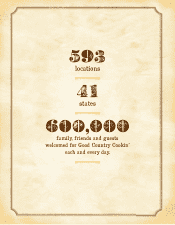
our network of almost 600 stores. A good carpenter says
that you measure twice and cut once. Well, we might even
measure a third time. Because of this approach, I’m pleased
to say that we’re already showing tangible progress with
several of our initiatives. We believe that the power of our
strong brand, combined with a more productive store base,
will help to propel our unique family dining concept to a
whole new level of sales and protability.
Net Cash Provided by Operating Activities
Cash Used to Purchase Property and Equipment
Fiscal Year
Cracker Barrel Old Country Store, Inc.
Cash Flow From Operations and
Capital Expenditures
$250
$200
$100
$0
$ in Millions
20082006 2009 2010
$150
$50
2007
Cracker Barrel Old Country Store, Inc.
Dividend Outlays
and Dividends Per Share
$25
$15
$10
$5
$0
Dividends on Common Stock (in millions)
20072006 2008 2009 2010
Fiscal Year
$20
Dividends Per Share
$1.00
$0.80
$0.60
$0.40
$0.20
$0.00
Dividends Paid on Common Stock
Dividends Per Share
11