Cogeco 2011 Annual Report Download - page 4
Download and view the complete annual report
Please find page 4 of the 2011 Cogeco annual report below. You can navigate through the pages in the report by either clicking on the pages listed below, or by using the keyword search tool below to find specific information within the annual report.-
 1
1 -
 2
2 -
 3
3 -
 4
4 -
 5
5 -
 6
6 -
 7
7 -
 8
8 -
 9
9 -
 10
10 -
 11
11 -
 12
12 -
 13
13 -
 14
14 -
 15
15 -
16
-
17
-
18
-
19
-
20
-
21
-
22
-
23
-
24
-
25
-
26
-
27
-
28
-
29
-
30
-
31
-
32
-
33
-
34
-
35
-
36
-
37
-
38
-
39
-
40
-
41
-
42
-
43
-
44
-
45
-
46
-
47
-
48
-
49
-
50
-
51
-
52
-
53
-
54
-
55
-
56
-
57
-
58
-
59
-
60
-
61
-
62
-
63
-
64
-
65
-
66
-
67
-
68
-
69
-
70
-
71
-
72
-
73
-
74
-
75
-
76
-
77
-
78
-
79
-
80
-
81
-
82
-
83
-
84
-
85
-
86
-
87
-
88
-
89
 |
 |

Financial highlights COGECO CABLE INC. 2011 3
Financial highlights
Years ended August 31, 2011 2010 Change
(in thousands of dollars, except percentages, RGU growth and per share data) $$%
Operations
Revenue 1,361,166 1,281,376 6.2
Operating income before amortization(1) 565,983 510,096 11.0
Operating margin(1) 41.6% 39.8% –
Operating income 318,805 251,225 26.9
Impairment of goodwill and fixed assets 225,873 – –
Net income (loss) (47,666) 157,303 –
A
djusted net income(1) 178,207 127,521 39.7
Cash Flow
Cash flow from operating activities 515,322 417,284 23.5
Cash flow from operations(1) 440,349 494,814 (11.0)
Capital expenditures and increase in deferred charges 336,592 319,682 5.3
Free cash flow(1) 103,757 175,132 (40.8)
Financial Condition
Fixed assets 1,254,576 1,325,077 (5.3)
Total assets 2,735,500 2,702,819 1.2
Indebtedness(2) 981,214 958,939 2.3
Shareholders’ equity 1,061,045 1,136,301 (6.6)
RGU growth 228,111 287,111 (20.5)
Per Share Data(3)
Earnings (loss) per share (0.98) 3.24 –
A
djusted earnings per share(1) 3.67 2.63 39.5
Weighted average number of outstanding shares 48,582,989 48,520,183 0.1
(1) The indicated terms do not have standardized definitions prescribed by Canadian Generally Accepted Accounting Principles (“GAAP”) and therefore, may not
be comparable to similar measures presented by other companies. For further details, please consult the “Non-GAAP financial measures” section on page 45 o
f
the Management’s Discussion and Analysis.
(2) Indebtedness is defined as the total of bank indebtedness, principal on long-term debt, balance due on a business acquisition and obligations under derivative
financial instruments.
(3) Per multiple and subordinate voting share.
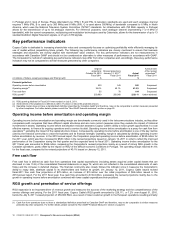
Original projections
October 28, 2010
Fiscal 2011
Revised projections
January 12, 2011(1)
Fiscal 2011
Actual
Fiscal 2011
Achievement
of the revised
projections(2)
Fiscal 2011
(in millions of dollars, except percentages and RGU growth) $$$
Financial guidelines
Revenue 1,340 1,360 1,361 Achieved
Operating income before amortization 530 545 566 Surpassed
Operating margin 39.6% 40.1% 41.6% Surpassed
A
mortization 275 265 247 Surpassed
Financial expense 70 72 72 Achieved
Current income taxes 65 63 63 Achieved
Net income (loss)(1) 120 (85) (48) Surpassed
Capital expenditures and increase in deferred charges 340 340 337 Achieved
Free cash flow 55 70 104 Surpassed
RGU growth(1) 250,000 250,000 228,111 Under-achieved
(1) Net income (loss) and RGU growth guidelines for Fiscal 2011 were revised on July 6, 2011.
(2) Achievement of the projections is defined as within 1% above or below the projected amount.