Cogeco 2011 Annual Report Download - page 11
Download and view the complete annual report
Please find page 11 of the 2011 Cogeco annual report below. You can navigate through the pages in the report by either clicking on the pages listed below, or by using the keyword search tool below to find specific information within the annual report.-
 1
1 -
 2
2 -
 3
3 -
 4
4 -
 5
5 -
 6
6 -
 7
7 -
 8
8 -
 9
9 -
 10
10 -
 11
11 -
 12
12 -
 13
13 -
 14
14 -
 15
15 -
 16
16 -
 17
17 -
 18
18 -
 19
19 -
 20
20 -
 21
21 -
 22
22 -
23
-
24
-
25
-
26
-
27
-
28
-
29
-
30
-
31
-
32
-
33
-
34
-
35
-
36
-
37
-
38
-
39
-
40
-
41
-
42
-
43
-
44
-
45
-
46
-
47
-
48
-
49
-
50
-
51
-
52
-
53
-
54
-
55
-
56
-
57
-
58
-
59
-
60
-
61
-
62
-
63
-
64
-
65
-
66
-
67
-
68
-
69
-
70
-
71
-
72
-
73
-
74
-
75
-
76
-
77
-
78
-
79
-
80
-
81
-
82
-
83
-
84
-
85
-
86
-
87
-
88
-
89
 |
 |

10 COGECO CABLE INC. 2011 Management’s Discussion and Analysis (MD&A)
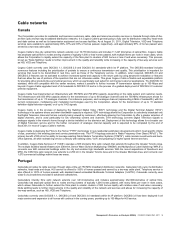
In Portugal and in most of Europe, Phase Alternated Line (“PAL”) B and PAL G television standards are used and each analogue channel
requires 7 MHz (PAL B is used up to 300 MHz) and 8 MHz (PAL G is used above 300 MHz) of bandwidth compared to 6 MHz in North
America, which uses the National Television System Committee (“NTSC”) standards. An infrastructure with 750 MHz capacity in Portugal
allows for the transmission of up to 83 analogue channels. For reference purposes, each analogue channel (representing 7 or 8 MHz of
bandwidth), with the current compression, multiplexing and modulation technologies used by Cabovisão, allows for the transmission of up to 13
standard definition Digital Television signals, or of up to 6 HD signals.
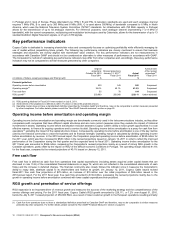
Key performance indicators
Cogeco Cable is dedicated to increasing shareholder value and consequently focuses on optimizing profitability while efficiently managing its
use of capital without jeopardizing future growth. The following key performance indicators are closely monitored to ensure that business
strategies and objectives are closely aligned with shareholder value creation. The key performance indicators are not measurements in
accordance with Canadian GAAP and should not be considered an alternative to other measures of performance in accordance with GAAP.
The Corporation’s method of calculating key performance indicators may differ from other companies and, accordingly, these key performance
indicators may not be comparable to similar measures presented by other companies.
Original
projections
October 28, 2010
Fiscal 2011
Revised projections
January 12, 2011(1)
Fiscal 2011
Actual
Fiscal 2011
Achievement
of the revised
projections(2)
Fiscal 2011
(in millions of dollars, except percentages and RGU growth) $$$
Financial guidelines
Operating income before amortization 530 545 566 Surpassed
Operating margin(3) 39.6% 40.1% 41.6% Surpassed
Free cash flow 55 70 104 Surpassed
RGU growth(1) 250,000 250,000 228,111 Under-achieved
(1) RGU growth guidelines for Fiscal 2011 were revised on July 6, 2011.
(2) Achievement of the projections is defined as within 1% above or below the projected amount.
(3) Operating margin does not have a standardized definition prescribed by Canadian GAAP and therefore, may not be comparable to similar measures presented
by other companies. For further details, please consult the “Non-GAAP financial measures” section on page 45.
Operating income before amortization and operating margin
Operating income before amortization and operating margin are benchmarks commonly used in the telecommunications industry, as they allow
comparisons with companies that have different capital structures and are more current measures since they exclude the impact of historical
investments in assets. Operating income before amortization evolution assesses Cogeco Cable’s ability to seize growth opportunities in a cost
effective manner, to finance its ongoing operations and to service its debt. Operating income before amortization is a proxy for cash flow from
operations(1) excluding the impact of the capital structure chosen. Consequently, operating income before amortization is one of the key metrics
used by the financial community to value the business and its financial strength. Operating margin is calculated by dividing operating income
before amortization by revenue. In the 2010 annual report, the Corporation projected operating income before amortization of $530 million for
the 2011 year, which was then increased to $545 million in the revised projections issued on January 12, 2011 in order to reflect the improved
performance of the Corporation during the first quarter and the expected trend for fiscal 2011. Operating income before amortization for the
2011 fiscal year amounted to $566 million, surpassing the Corporation’s revised projections mainly as a result of strong RGU growth in the
Canadian operations, partly offset by the impact on RGU of the difficult economic conditions in Portugal. The operating margin reached 41.6%
for the fiscal year, compared to the revised projections of 40.1% issued on January 12, 2011.
Free cash flow
Free cash flow is defined as cash flow from operations less capital expenditures (including assets acquired under capital leases that are
disclosed in note 15 B) of the consolidated financial statements on page 72, which are not reflected in the consolidated statements of cash
flows) and the increase in deferred charges. The financial community also closely follows this indicator since it measures the Corporation’s
ability to repay debt, distribute capital to its shareholders and finance its growth. On January 12, 2011, Cogeco Cable issued revised
fiscal 2011 free cash flow projections of $70 million, an increase of $15 million over the initial projections of $55 million issued in the
2010 annual report. For the 2011 fiscal year, free cash flow amounted to $104 million, surpassing the revised projections mainly due to the
growth in operating income before amortization combined with lower capital expenditures than projected.
RGU growth and penetration of service offerings
RGU expansion is an important driver of revenue growth and measures the success of the marketing strategy and the competitiveness of the
service offerings and pricing. For the 2011 fiscal year, Cogeco Cable’s RGU growth amounted to 228,111, or 7.2% over August 31, 2010,
below the July 6, 2011 revised projection of 250,000 RGU, as a result of lower customer growth in the European operations resulting primarily
(1) Cash flow from operations does not have a standardized definition prescribed by Canadian GAAP and therefore, may not be comparable to similar measures
presented by other companies. For further details, please consult the “Non-GAAP Financial Measures” section on page 45.