Citrix 2007 Annual Report Download - page 2
Download and view the complete annual report
Please find page 2 of the 2007 Citrix annual report below. You can navigate through the pages in the report by either clicking on the pages listed below, or by using the keyword search tool below to find specific information within the annual report.-
 1
1 -
 2
2 -
 3
3 -
 4
4 -
 5
5 -
 6
6 -
 7
7 -
 8
8 -
 9
9 -
 10
10 -
 11
11 -
 12
12 -
 13
13 -
14
-
15
-
16
-
17
-
18
-
19
-
20
-
21
-
22
-
23
-
24
-
25
-
26
-
27
-
28
-
29
-
30
-
31
-
32
-
33
-
34
-
35
-
36
-
37
-
38
-
39
-
40
-
41
-
42
-
43
-
44
-
45
-
46
-
47
-
48
-
49
-
50
-
51
-
52
-
53
-
54
-
55
-
56
-
57
-
58
-
59
-
60
-
61
-
62
-
63
-
64
-
65
-
66
-
67
-
68
-
69
-
70
-
71
-
72
-
73
-
74
-
75
-
76
-
77
-
78
-
79
-
80
-
81
-
82
-
83
-
84
-
85
-
86
-
87
-
88
-
89
-
90
-
91
-
92
-
93
-
94
-
95
-
96
-
97
-
98
-
99
-
100
-
101
-
102
-
103
-
104
-
105
-
106
-
107
-
108
-
109
-
110
-
111
-
112
-
113
-
114
-
115
-
116
-
117
-
118
-
119
-
120
-
121
-
122
-
123
-
124
-
125
-
126
-
127
-
128
-
129
-
130
-
131
-
132
 |
 |

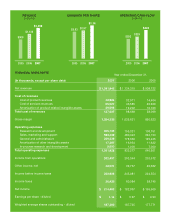
REVENUE
(millions)
2005 2006 2007
$909
$1,134
$1,392
EARNINGS PER SHARE
2005 2006 2007
$0.93 $0.97
$1.14
OPERATING CASH FLOW
(millions)
2005 2006 2007
$293 $329
$424
FINANCIAL HIGHLIGHTS
(In thousands, except per share data) 2007 2006 2005
Net revenues
Cost of revenues
Cost of product revenues
Cost of services revenues
Amortization of product related intangible assets
Total cost of revenues
Gross margin
Operating expenses
Research and development
Sales, marketing and support
General and administrative
Amortization of other intangible assets
In-process research and development
Total operating expenses
Income from operations
Other income, net
Income before income taxes
Income taxes
Net income
Earnings per share - diluted
Weighted average shares outstanding - diluted
$ 1,391,942
42,984
65,027
29,596
137,607
1,254,335
205,103
590,409
229,229
17,387
9,800
1,051,928
202,407
48,501
250,908
36,425
$ 214,483
$ 1.14
187,380
Year ended December 31,
$ 1,134,319
32,911
46,585
19,202
98,698
1,035,621
155,331
480,343
178,669
16,934
1,000
832,277
203,344
39,737
243,081
60,084
$ 182,997
$ 0.97
187,725
$ 908,722
14,404
26,929
16,766
58,099
850,623
108,751
394,153
125,425
11,622
7,000
646,951
203,672
20,682
224,354
58,745
$ 165,609
$ 0.93
177,771