Chrysler 2014 Annual Report Download - page 88
Download and view the complete annual report
Please find page 88 of the 2014 Chrysler annual report below. You can navigate through the pages in the report by either clicking on the pages listed below, or by using the keyword search tool below to find specific information within the annual report.-
 1
1 -
2
-
3
-
4
-
5
-
6
-
7
-
8
-
9
-
10
-
11
-
12
-
13
-
14
-
15
-
16
-
17
-
18
-
19
-
20
-
21
-
22
-
23
-
24
-
25
-
26
-
27
-
28
-
29
-
30
-
31
-
32
-
33
-
34
-
35
-
36
-
37
-
38
-
39
-
40
-
41
-
42
-
43
-
44
-
45
-
46
-
47
-
48
-
49
-
50
-
51
-
52
-
53
-
54
-
55
-
56
-
57
-
58
-
59
-
60
-
61
-
62
-
63
-
64
-
65
-
66
-
67
-
68
-
69
-
70
-
71
-
72
-
73
-
74
-
75
-
76
-
77
-
 78
78 -
 79
79 -
 80
80 -
 81
81 -
 82
82 -
 83
83 -
 84
84 -
 85
85 -
 86
86 -
 87
87 -
 88
88 -
 89
89 -
 90
90 -
 91
91 -
 92
92 -
 93
93 -
 94
94 -
 95
95 -
 96
96 -
 97
97 -
 98
98 -
99
-
100
-
101
-
102
-
103
-
104
-
105
-
106
-
107
-
108
-
109
-
110
-
111
-
112
-
113
-
114
-
115
-
116
-
117
-
118
-
119
-
120
-
121
-
122
-
123
-
124
-
125
-
126
-
127
-
128
-
129
-
130
-
131
-
132
-
133
-
134
-
135
-
136
-
137
-
138
-
139
-
140
-
141
-
142
-
143
-
144
-
145
-
146
-
147
-
148
-
149
-
150
-
151
-
152
-
153
-
154
-
155
-
156
-
157
-
158
-
159
-
160
-
161
-
162
-
163
-
164
-
165
-
166
-
167
-
168
-
169
-
170
-
171
-
172
-
173
-
174
-
175
-
176
-
177
-
178
-
179
-
180
-
181
-
182
-
183
-
184
-
185
-
186
-
187
-
188
-
189
-
190
-
191
-
192
-
193
-
194
-
195
-
196
-
197
-
198
-
199
-
200
-
201
-
202
-
203
-
204
-
205
-
206
-
207
-
208
-
209
-
210
-
211
-
212
-
213
-
214
-
215
-
216
-
217
-
218
-
219
-
220
-
221
-
222
-
223
-
224
-
225
-
226
-
227
-
228
-
229
-
230
-
231
-
232
-
233
-
234
-
235
-
236
-
237
-
238
-
239
-
240
-
241
-
242
-
243
-
244
-
245
-
246
-
247
-
248
-
249
-
250
-
251
-
252
-
253
-
254
-
255
-
256
-
257
-
258
-
259
-
260
-
261
-
262
-
263
-
264
-
265
-
266
-
267
-
268
-
269
-
270
-
271
-
272
-
273
-
274
-
275
-
276
-
277
-
278
-
279
-
280
-
281
-
282
-
283
-
284
-
285
-
286
-
287
-
288
-
289
-
290
-
291
-
292
-
293
-
294
-
295
-
296
-
297
-
298
-
299
-
300
-
301
-
302
-
303
 |
 |

86 2014 | ANNUAL REPORT
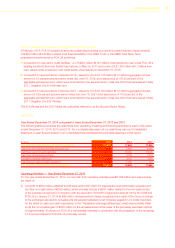
Operating Results
Net Industrial Debt
Net Industrial Debt is management’s primary measure for analyzing our financial leverage and capital structure and is
one of the key targets used to measure our performance.
The following table details our Net Debt for industrial activities and financial services at December 31, 2014 and
December 31, 2013.
All FCA US activities are included under industrial activities. Since FCA US’s treasury activities (including funding and
cash management) are managed separately from the rest of the Group we also provide the analysis of Net Industrial
Debt split between FCA excluding FCA US, and FCA US.
December 31, 2014 December 31, 2013
Industrial
Activities
Financial
Services
Consoli-
dated
Industrial
Activities
Financial
Services
Consoli-
dated
(€ million) Total
FCA ex
FCA US FCA US Total
FCA ex
FCA US FCA US
Third Parties Debt (Principal) (31,381) (21,011) (10,370) (1,980) (33,361) (27,624) (18,325) (9,299) (2,031) (29,655)
Capital Market(1) (17,378) (12,473) (4,905) (351) (17,729) (13,981) (11,661) (2,320) (239) (14,220)
Bank Debt (11,904) (7,484) (4,420) (1,216) (13,120) (7,635) (5,095) (2,540) (1,297) (8,932)
Other Debt(2) (2,099) (1,054) (1,045) (413) (2,512) (6,008) (1,569) (4,439) (495) (6,503)
Accrued Interest and Other
Adjustments(3) (362) (200) (162) (1) (363) (626) (467) (159) (2) (628)
Debt with third Parties (31,743) (21,211) (10,532) (1,981) (33,724) (28,250) (18,792) (9,458) (2,033) (30,283)
Intercompany Financial
Receivables/Payables (net)(4) 1,453 1,515 (62) (1,453) — 1,336 1,415 (79) (1,336) —
Current financial receivables
from jointly-controlled financial
services companies(5) 58 58 — — 58 27 27 — — 27
Debt, net of intercompany and
current financial receivables
from jointly-controlled financial
services companies (30,232) (19,638) (10,594) (3,434) (33,666) (26,887) (17,350) (9,537) (3,369) (30,256)
Other financial assets/
(liabilities) (net)(6) (229) (251) 22 (4) (233) 399 323 76 (3) 396
Current securities 180 180 — 30 210 219 219 — 28 247
Cash and cash equivalents 22,627 10,653 11,974 213 22,840 19,255 9,579 9,676 200 19,455
Net Debt (7,654) (9,056) 1,402 (3,195) (10,849) (7,014) (7,229) 215 (3,144) (10,158)
(1) Includes bonds (€16,980 million at December 31, 2014 and €13,966 million at December 31, 2013) and other securities issued in financial
markets (€749 million, which includes the coupon related to mandatory convertible securities issuance, at December 31, 2014 and €254 million
at December 31, 2013 mainly from LATAM financial services companies.
(2) Includes The VEBA Trust Note (€3,419 million at December 31, 2013), Canadian HCT notes (€620 million at December 31, 2014 and
€664 million at December 31, 2013), asset backed financing, i.e. sales of receivables for which derecognition is not allowed under IFRS (€469
million at December 31, 2014 and €756 million at December 31, 2013), arrangements accounted for as a lease under IFRIC 4 -Determining
whether an arrangement contains a lease, and other financial payables. All amounts outstanding under the VEBA Trust Note were prepaid on
February 7, 2014.
(3) Includes adjustments for fair value accounting on debt (€67 million at December 31, 2014 and €78 million at December 31, 2013) and (accrued)/
deferred interest and other amortizing cost adjustments (€296 million at December 31, 2014 and €550 million net at December 31, 2013).
(4) Net amount between Industrial Activities financial receivables due from Financial Services (€1,595 million at December 31, 2014 and €1,465
million at December 31, 2013 and Industrial Activities financial payables due to Financial Services (€142 million at December 31, 2014 and
€129 million at December 31, 2013).
(5) Financial receivables from FCA Bank (previously known as FGA Capital S.p.A, or FGAC.
(6) Fair value of derivative financial instruments (net negative €271 million at December 31, 2014 and net positive €376 million at December 31,
2013) and collateral deposits (€38 million at December 31, 2014 and €20 million at December 31, 2013).