Chrysler 2014 Annual Report Download - page 152
Download and view the complete annual report
Please find page 152 of the 2014 Chrysler annual report below. You can navigate through the pages in the report by either clicking on the pages listed below, or by using the keyword search tool below to find specific information within the annual report.-
 1
1 -
2
-
3
-
4
-
5
-
6
-
7
-
8
-
9
-
10
-
11
-
12
-
13
-
14
-
15
-
16
-
17
-
18
-
19
-
20
-
21
-
22
-
23
-
24
-
25
-
26
-
27
-
28
-
29
-
30
-
31
-
32
-
33
-
34
-
35
-
36
-
37
-
38
-
39
-
40
-
41
-
42
-
43
-
44
-
45
-
46
-
47
-
48
-
49
-
50
-
51
-
52
-
53
-
54
-
55
-
56
-
57
-
58
-
59
-
60
-
61
-
62
-
63
-
64
-
65
-
66
-
67
-
68
-
69
-
70
-
71
-
72
-
73
-
74
-
75
-
76
-
77
-
78
-
79
-
80
-
81
-
82
-
83
-
84
-
85
-
86
-
87
-
88
-
89
-
90
-
91
-
92
-
93
-
94
-
95
-
96
-
97
-
98
-
99
-
100
-
101
-
102
-
103
-
104
-
105
-
106
-
107
-
108
-
109
-
110
-
111
-
112
-
113
-
114
-
115
-
116
-
117
-
118
-
119
-
120
-
121
-
122
-
123
-
124
-
125
-
126
-
127
-
128
-
129
-
130
-
131
-
132
-
133
-
134
-
135
-
136
-
137
-
138
-
139
-
140
-
141
-
 142
142 -
 143
143 -
 144
144 -
 145
145 -
 146
146 -
 147
147 -
 148
148 -
 149
149 -
 150
150 -
 151
151 -
 152
152 -
 153
153 -
 154
154 -
 155
155 -
 156
156 -
 157
157 -
 158
158 -
 159
159 -
 160
160 -
 161
161 -
 162
162 -
163
-
164
-
165
-
166
-
167
-
168
-
169
-
170
-
171
-
172
-
173
-
174
-
175
-
176
-
177
-
178
-
179
-
180
-
181
-
182
-
183
-
184
-
185
-
186
-
187
-
188
-
189
-
190
-
191
-
192
-
193
-
194
-
195
-
196
-
197
-
198
-
199
-
200
-
201
-
202
-
203
-
204
-
205
-
206
-
207
-
208
-
209
-
210
-
211
-
212
-
213
-
214
-
215
-
216
-
217
-
218
-
219
-
220
-
221
-
222
-
223
-
224
-
225
-
226
-
227
-
228
-
229
-
230
-
231
-
232
-
233
-
234
-
235
-
236
-
237
-
238
-
239
-
240
-
241
-
242
-
243
-
244
-
245
-
246
-
247
-
248
-
249
-
250
-
251
-
252
-
253
-
254
-
255
-
256
-
257
-
258
-
259
-
260
-
261
-
262
-
263
-
264
-
265
-
266
-
267
-
268
-
269
-
270
-
271
-
272
-
273
-
274
-
275
-
276
-
277
-
278
-
279
-
280
-
281
-
282
-
283
-
284
-
285
-
286
-
287
-
288
-
289
-
290
-
291
-
292
-
293
-
294
-
295
-
296
-
297
-
298
-
299
-
300
-
301
-
302
-
303
 |
 |

150 2014 | ANNUAL REPORT
Consolidated
Financial Statements
Notes to the Consolidated
Financial Statements
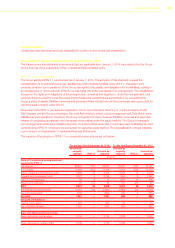
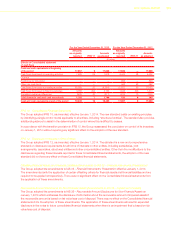
For the Year Ended December 31, 2013 For the Year Ended December 31, 2012
Amounts
as originally
reported IFRS 11
Amounts
as adjusted
Amounts
as originally
reported IFRS 11
Amounts
as adjusted
(€ million)
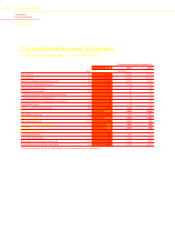
Items of Consolidated statement of
comprehensive income/(loss) impacted by
IFRS 11
Net profit 1,951 — 1,951 896 — 896
Gains/(losses) on remeasurement of defined
benefit plans, net of tax 2,678 (2) 2,676 (1,839) — (1,839)
Share of gains/(losses) on remeasurement of
defined benefit plans for equity method investees (9) 2 (7) — — —
Exchange differences on translating foreign
operations (708) (12) (720) (270) (15) (285)
Share of Other comprehensive income/(loss) for
equity method investees (100) 12 (88) 21 15 36
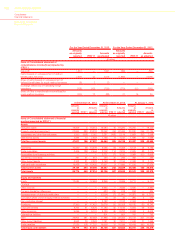
At December 31, 2013 At December 31, 2012 At January 1, 2012
Amounts
as
originally
reported IFRS 11
Amounts
as
adjusted
Amounts
as
originally
reported IFRS 11
Amounts
as
adjusted
Amounts
as
originally
reported IFRS 11
Amounts
as
adjusted
(€ million)
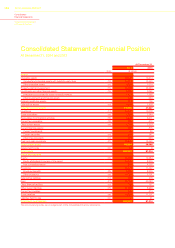
Items of Consolidated statement of financial
position impacted by IFRS 11
Assets
Intangible assets 19,509 5 19,514 19,284 10 19,294 18,200 — 18,200
Property, plant and equipment 22,844 389 23,233 22,062 434 22,496 20,830 295 21,125
Investments and other financial assets 2,260 (208) 2,052 2,287 (168) 2,119 2,663 (97) 2,566
Deferred tax assets 2,893 10 2,903 1,738 9 1,747 1,689 10 1,699
Total Non-current assets 47,611 196 47,807 45,464 285 45,749 43,487 208 43,695
Inventories 10,230 48 10,278 9,295 64 9,359 9,123 43 9,166
Trade receivables 2,406 138 2,544 2,702 114 2,816 2,625 89 2,714
Receivables from financing activities — — — 3,727 (7) 3,720 3,968 (15) 3,953
Current tax receivables 291 21 312 236 30 266 369 — 369
Other current assets 2,302 21 2,323 2,163 32 2,195 2,088 13 2,101
Cash and cash equivalents 19,439 16 19,455 17,657 9 17,666 17,526 — 17,526
Total Current assets 39,154 244 39,398 36,587 242 36,829 36,488 130 36,618
Total Assets 86,774 440 87,214 82,106 527 82,633 80,041 338 80,379
Equity and liabilities
Equity 12,584 — 12,584 8,369 — 8,369 9,711 — 9,711
Of which
Other reserves — — — 3,935 — 3,935 3,930 — 3,930
Currency translation differences — — — 633 (15) 618 834 — 834
Remeasurement of defined benefit plans — — — (2,534) (7) (2,541) (1,287) (4) (1,291)
Cumulative share of OCI of equity method investees — — — 18 22 40 (83) 4 (79)
Non-controlling interest — — — 2,182 — 2,182 2,353 — 2,353
Provisions 17,360 67 17,427 20,276 52 20,328 18,182 60 18,242
Employee benefits 8,265 61 8,326 11,486 60 11,546 9,584 56 9,640
Other provisions 9,095 6 9,101 8,790 (8) 8,782 8,598 4 8,602
Deferred tax liabilities — — — 801 — 801 761 1 762
Debt 29,902 381 30,283 27,889 414 28,303 26,772 321 27,093
Other current liabilities 8,943 20 8,963 7,781 30 7,811 7,538 21 7,559
Trade payables 17,235 (28) 17,207 16,558 31 16,589 16,418 (65) 16,353
Total Equity and liabilities 86,774 440 87,214 82,106 527 82,633 80,041 338 80,379