Chrysler 2014 Annual Report Download - page 78
Download and view the complete annual report
Please find page 78 of the 2014 Chrysler annual report below. You can navigate through the pages in the report by either clicking on the pages listed below, or by using the keyword search tool below to find specific information within the annual report.-
 1
1 -
2
-
3
-
4
-
5
-
6
-
7
-
8
-
9
-
10
-
11
-
12
-
13
-
14
-
15
-
16
-
17
-
18
-
19
-
20
-
21
-
22
-
23
-
24
-
25
-
26
-
27
-
28
-
29
-
30
-
31
-
32
-
33
-
34
-
35
-
36
-
37
-
38
-
39
-
40
-
41
-
42
-
43
-
44
-
45
-
46
-
47
-
48
-
49
-
50
-
51
-
52
-
53
-
54
-
55
-
56
-
57
-
58
-
59
-
60
-
61
-
62
-
63
-
64
-
65
-
66
-
67
-
 68
68 -
 69
69 -
 70
70 -
 71
71 -
 72
72 -
 73
73 -
 74
74 -
 75
75 -
 76
76 -
 77
77 -
 78
78 -
 79
79 -
 80
80 -
 81
81 -
 82
82 -
 83
83 -
 84
84 -
 85
85 -
 86
86 -
 87
87 -
 88
88 -
89
-
90
-
91
-
92
-
93
-
94
-
95
-
96
-
97
-
98
-
99
-
100
-
101
-
102
-
103
-
104
-
105
-
106
-
107
-
108
-
109
-
110
-
111
-
112
-
113
-
114
-
115
-
116
-
117
-
118
-
119
-
120
-
121
-
122
-
123
-
124
-
125
-
126
-
127
-
128
-
129
-
130
-
131
-
132
-
133
-
134
-
135
-
136
-
137
-
138
-
139
-
140
-
141
-
142
-
143
-
144
-
145
-
146
-
147
-
148
-
149
-
150
-
151
-
152
-
153
-
154
-
155
-
156
-
157
-
158
-
159
-
160
-
161
-
162
-
163
-
164
-
165
-
166
-
167
-
168
-
169
-
170
-
171
-
172
-
173
-
174
-
175
-
176
-
177
-
178
-
179
-
180
-
181
-
182
-
183
-
184
-
185
-
186
-
187
-
188
-
189
-
190
-
191
-
192
-
193
-
194
-
195
-
196
-
197
-
198
-
199
-
200
-
201
-
202
-
203
-
204
-
205
-
206
-
207
-
208
-
209
-
210
-
211
-
212
-
213
-
214
-
215
-
216
-
217
-
218
-
219
-
220
-
221
-
222
-
223
-
224
-
225
-
226
-
227
-
228
-
229
-
230
-
231
-
232
-
233
-
234
-
235
-
236
-
237
-
238
-
239
-
240
-
241
-
242
-
243
-
244
-
245
-
246
-
247
-
248
-
249
-
250
-
251
-
252
-
253
-
254
-
255
-
256
-
257
-
258
-
259
-
260
-
261
-
262
-
263
-
264
-
265
-
266
-
267
-
268
-
269
-
270
-
271
-
272
-
273
-
274
-
275
-
276
-
277
-
278
-
279
-
280
-
281
-
282
-
283
-
284
-
285
-
286
-
287
-
288
-
289
-
290
-
291
-
292
-
293
-
294
-
295
-
296
-
297
-
298
-
299
-
300
-
301
-
302
-
303
 |
 |

76 2014 | ANNUAL REPORT
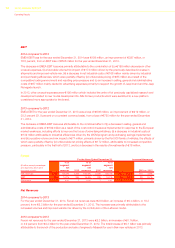
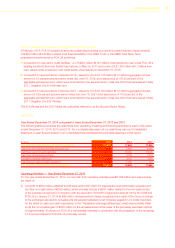
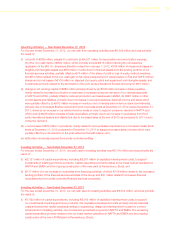
Operating Results
Components
For the Years Ended December 31, Increase/(decrease)
(€ million, except percentages) 2014
% of
segment
net
revenues 2013
% of
segment
net
revenues 2012
% of
segment
net
revenues 2014 vs. 2013 2013 vs. 2012
Magneti Marelli
Net revenues 6,500 5,988 5,828 512 8.6% 160 2.7%
EBIT 204 169 131 35 20.7% 38 29.0%
Teksid
Net revenues 639 688 780 (49) (7.1)% (92) (11.8)%
EBIT (4) (70) 4 66 (94.3)% (74) n.m.
Comau
Net revenues 1,550 1,463 1,482 87 5.9% (19) (1.3)%
EBIT 60 47 30 13 27.7% 17 56.7%
Intrasegment eliminations
Net revenues (70) (59) (60) (11) 18.6% 1 (1.7)%
Components
Net revenues 8,619 100.0% 8,080 100.0% 8,030 100.0% 539 6.7% 50 0.6%
EBIT 260 3.0% 146 1.8% 165 2.1% 114 78.1% (19) (11.5)%
Net revenues
2014 compared to 2013
Components net revenues for the year ended December 31, 2014, revenues were €8.6 billion, an increase of
€0.5 billion, or 6.7 percent (9.3 percent on a constant currency basis), from €8.1 billion for the year ended December
31, 2013.
Magneti Marelli
Magneti Marelli net revenues for the year ended December 31, 2014, were €6.5 billion, an increase of €0.5 billion, or
8.6 percent, from €6.0 billion for the year ended December 31, 2013 primarily reflecting positive performance in North
America, China and Europe, partially offset by performance in Brazil, which was impacted by the weakening of the
Brazilian Real against the Euro.
Teksid
Teksid net revenues for the year ended December 31, 2014 were €639 million, a decrease of €49 million, or
7.1 percent, from €688 million for the year ended December 31, 2013, primarily attributable to a 4.0 percent decrease
in cast iron business volumes, which were partially offset by a 24.0 percent increase in aluminum business volumes.
Comau
Comau net revenues for the year ended December 31, 2014 were €1.6 billion, an increase of €0.1 billion,
or 5.9 percent, from €1.5 billion for the year ended December 31, 2013, mainly attributable to the body welding
business.